- Hong Kong
- /
- Consumer Services
- /
- SEHK:2262
Steve Leung Design Group's (HKG:2262) Shareholders Are Down 37% On Their Shares
Passive investing in an index fund is a good way to ensure your own returns roughly match the overall market. While individual stocks can be big winners, plenty more fail to generate satisfactory returns. That downside risk was realized by Steve Leung Design Group Limited (HKG:2262) shareholders over the last year, as the share price declined 37%. That falls noticeably short of the market return of around 20%. Steve Leung Design Group hasn't been listed for long, so although we're wary of recent listings that perform poorly, it may still prove itself with time. It's down 5.6% in the last seven days.
View our latest analysis for Steve Leung Design Group
In his essay The Superinvestors of Graham-and-Doddsville Warren Buffett described how share prices do not always rationally reflect the value of a business. One imperfect but simple way to consider how the market perception of a company has shifted is to compare the change in the earnings per share (EPS) with the share price movement.
During the unfortunate twelve months during which the Steve Leung Design Group share price fell, it actually saw its earnings per share (EPS) improve by 129%. It could be that the share price was previously over-hyped.
It's surprising to see the share price fall so much, despite the improved EPS. But we might find some different metrics explain the share price movements better.
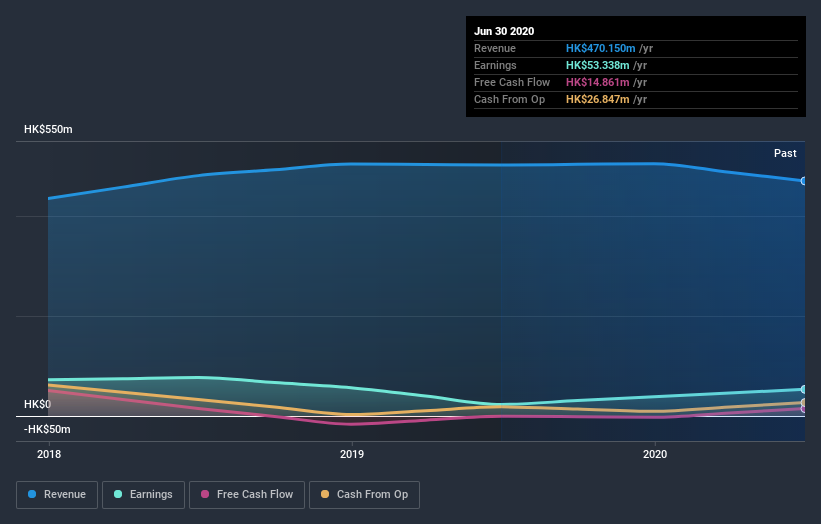
Given the yield is quite low, at 1.5%, we doubt the dividend can shed much light on the share price. On the other hand, we're certainly perturbed by the 6.3% decline in Steve Leung Design Group's revenue. Many investors see falling revenue as a likely precursor to lower earnings, so this could well explain the weak share price.
The company's revenue and earnings (over time) are depicted in the image below (click to see the exact numbers).

Take a more thorough look at Steve Leung Design Group's financial health with this free report on its balance sheet.
A Different Perspective
Given that the market gained 20% in the last year, Steve Leung Design Group shareholders might be miffed that they lost 36% (even including dividends). However, keep in mind that even the best stocks will sometimes underperform the market over a twelve month period. The share price decline has continued throughout the most recent three months, down 6.6%, suggesting an absence of enthusiasm from investors. Given the relatively short history of this stock, we'd remain pretty wary until we see some strong business performance. It's always interesting to track share price performance over the longer term. But to understand Steve Leung Design Group better, we need to consider many other factors. Take risks, for example - Steve Leung Design Group has 2 warning signs (and 1 which is concerning) we think you should know about.
If you would prefer to check out another company -- one with potentially superior financials -- then do not miss this free list of companies that have proven they can grow earnings.
Please note, the market returns quoted in this article reflect the market weighted average returns of stocks that currently trade on HK exchanges.
When trading Steve Leung Design Group or any other investment, use the platform considered by many to be the Professional's Gateway to the Worlds Market, Interactive Brokers. You get the lowest-cost* trading on stocks, options, futures, forex, bonds and funds worldwide from a single integrated account. Promoted
The New Payments ETF Is Live on NASDAQ:
Money is moving to real-time rails, and a newly listed ETF now gives investors direct exposure. Fast settlement. Institutional custody. Simple access.
Explore how this launch could reshape portfolios
Sponsored ContentNew: Manage All Your Stock Portfolios in One Place
We've created the ultimate portfolio companion for stock investors, and it's free.
• Connect an unlimited number of Portfolios and see your total in one currency
• Be alerted to new Warning Signs or Risks via email or mobile
• Track the Fair Value of your stocks
This article by Simply Wall St is general in nature. It does not constitute a recommendation to buy or sell any stock, and does not take account of your objectives, or your financial situation. We aim to bring you long-term focused analysis driven by fundamental data. Note that our analysis may not factor in the latest price-sensitive company announcements or qualitative material. Simply Wall St has no position in any stocks mentioned.
*Interactive Brokers Rated Lowest Cost Broker by StockBrokers.com Annual Online Review 2020
Have feedback on this article? Concerned about the content? Get in touch with us directly. Alternatively, email editorial-team (at) simplywallst.com.
About SEHK:2262
Steve Leung Design Group
Engages in the provision of interior design services in the People’s Republic of China, Hong Kong, and Macau.
Flawless balance sheet and slightly overvalued.
Market Insights
Weekly Picks

Early mover in a fast growing industry. Likely to experience share price volatility as they scale


A case for CA$31.80 (undiluted), aka 8,616% upside from CA$0.37 (an 86 bagger!).


Moderation and Stabilisation: HOLD: Fair Price based on a 4-year Cycle is $12.08
Recently Updated Narratives

Airbnb Stock: Platform Growth in a World of Saturation and Scrutiny

Adobe Stock: AI-Fueled ARR Growth Pushes Guidance Higher, But Cost Pressures Loom

Thomson Reuters Stock: When Legal Intelligence Becomes Mission-Critical Infrastructure
Popular Narratives


Crazy Undervalued 42 Baggers Silver Play (Active & Running Mine)


NVDA: Expanding AI Demand Will Drive Major Data Center Investments Through 2026


The AI Infrastructure Giant Grows Into Its Valuation
Trending Discussion


