- Hong Kong
- /
- Consumer Services
- /
- SEHK:2262
Investors Could Be Concerned With Steve Leung Design Group's (HKG:2262) Returns On Capital

To find a multi-bagger stock, what are the underlying trends we should look for in a business? Firstly, we'll want to see a proven return on capital employed (ROCE) that is increasing, and secondly, an expanding base of capital employed. If you see this, it typically means it's a company with a great business model and plenty of profitable reinvestment opportunities. However, after briefly looking over the numbers, we don't think Steve Leung Design Group (HKG:2262) has the makings of a multi-bagger going forward, but let's have a look at why that may be.
Understanding Return On Capital Employed (ROCE)
For those that aren't sure what ROCE is, it measures the amount of pre-tax profits a company can generate from the capital employed in its business. Analysts use this formula to calculate it for Steve Leung Design Group:
Return on Capital Employed = Earnings Before Interest and Tax (EBIT) ÷ (Total Assets - Current Liabilities)
0.10 = HK$55m ÷ (HK$710m - HK$172m) (Based on the trailing twelve months to December 2020).
So, Steve Leung Design Group has an ROCE of 10%. On its own, that's a standard return, however it's much better than the 7.7% generated by the Consumer Services industry.
See our latest analysis for Steve Leung Design Group
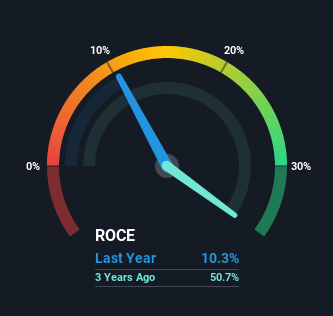
While the past is not representative of the future, it can be helpful to know how a company has performed historically, which is why we have this chart above. If you'd like to look at how Steve Leung Design Group has performed in the past in other metrics, you can view this free graph of past earnings, revenue and cash flow.
What Does the ROCE Trend For Steve Leung Design Group Tell Us?
In terms of Steve Leung Design Group's historical ROCE movements, the trend isn't fantastic. Over the last five years, returns on capital have decreased to 10% from 34% five years ago. Given the business is employing more capital while revenue has slipped, this is a bit concerning. This could mean that the business is losing its competitive advantage or market share, because while more money is being put into ventures, it's actually producing a lower return - "less bang for their buck" per se.
On a side note, Steve Leung Design Group has done well to pay down its current liabilities to 24% of total assets. So we could link some of this to the decrease in ROCE. What's more, this can reduce some aspects of risk to the business because now the company's suppliers or short-term creditors are funding less of its operations. Some would claim this reduces the business' efficiency at generating ROCE since it is now funding more of the operations with its own money.
What We Can Learn From Steve Leung Design Group's ROCE
From the above analysis, we find it rather worrisome that returns on capital and sales for Steve Leung Design Group have fallen, meanwhile the business is employing more capital than it was five years ago. Long term shareholders who've owned the stock over the last year have experienced a 37% depreciation in their investment, so it appears the market might not like these trends either. With underlying trends that aren't great in these areas, we'd consider looking elsewhere.
Steve Leung Design Group does have some risks, we noticed 3 warning signs (and 1 which is a bit unpleasant) we think you should know about.
If you want to search for solid companies with great earnings, check out this free list of companies with good balance sheets and impressive returns on equity.
If you're looking for stocks to buy, use the lowest-cost* platform that is rated #1 Overall by Barron’s, Interactive Brokers. Trade stocks, options, futures, forex, bonds and funds on 135 markets, all from a single integrated account. Promoted
The New Payments ETF Is Live on NASDAQ:
Money is moving to real-time rails, and a newly listed ETF now gives investors direct exposure. Fast settlement. Institutional custody. Simple access.
Explore how this launch could reshape portfolios
Sponsored ContentNew: Manage All Your Stock Portfolios in One Place
We've created the ultimate portfolio companion for stock investors, and it's free.
• Connect an unlimited number of Portfolios and see your total in one currency
• Be alerted to new Warning Signs or Risks via email or mobile
• Track the Fair Value of your stocks
This article by Simply Wall St is general in nature. It does not constitute a recommendation to buy or sell any stock, and does not take account of your objectives, or your financial situation. We aim to bring you long-term focused analysis driven by fundamental data. Note that our analysis may not factor in the latest price-sensitive company announcements or qualitative material. Simply Wall St has no position in any stocks mentioned.
*Interactive Brokers Rated Lowest Cost Broker by StockBrokers.com Annual Online Review 2020
Have feedback on this article? Concerned about the content? Get in touch with us directly. Alternatively, email editorial-team (at) simplywallst.com.
About SEHK:2262
Steve Leung Design Group
Engages in the provision of interior design services in the People’s Republic of China, Hong Kong, and Macau.
Flawless balance sheet and slightly overvalued.
Market Insights

Weekly Picks

Early mover in a fast growing industry. Likely to experience share price volatility as they scale


A case for CA$31.80 (undiluted), aka 8,616% upside from CA$0.37 (an 86 bagger!).


Moderation and Stabilisation: HOLD: Fair Price based on a 4-year Cycle is $12.08
Recently Updated Narratives

Airbnb Stock: Platform Growth in a World of Saturation and Scrutiny

Adobe Stock: AI-Fueled ARR Growth Pushes Guidance Higher, But Cost Pressures Loom

Thomson Reuters Stock: When Legal Intelligence Becomes Mission-Critical Infrastructure
Popular Narratives


Crazy Undervalued 42 Baggers Silver Play (Active & Running Mine)


NVDA: Expanding AI Demand Will Drive Major Data Center Investments Through 2026

The AI Infrastructure Giant Grows Into Its Valuation
Trending Discussion


