
Advertisement
Howard Marks put it nicely when he said that, rather than worrying about share price volatility, 'The possibility of permanent loss is the risk I worry about... and every practical investor I know worries about.' When we think about how risky a company is, we always like to look at its use of debt, since debt overload can lead to ruin. Importantly, Tu Yi Holding Company Limited (HKG:1701) does carry debt. But the more important question is: how much risk is that debt creating?
Why Does Debt Bring Risk?
Debt and other liabilities become risky for a business when it cannot easily fulfill those obligations, either with free cash flow or by raising capital at an attractive price. Ultimately, if the company can't fulfill its legal obligations to repay debt, shareholders could walk away with nothing. While that is not too common, we often do see indebted companies permanently diluting shareholders because lenders force them to raise capital at a distressed price. Having said that, the most common situation is where a company manages its debt reasonably well - and to its own advantage. When we examine debt levels, we first consider both cash and debt levels, together.
Check out our latest analysis for Tu Yi Holding
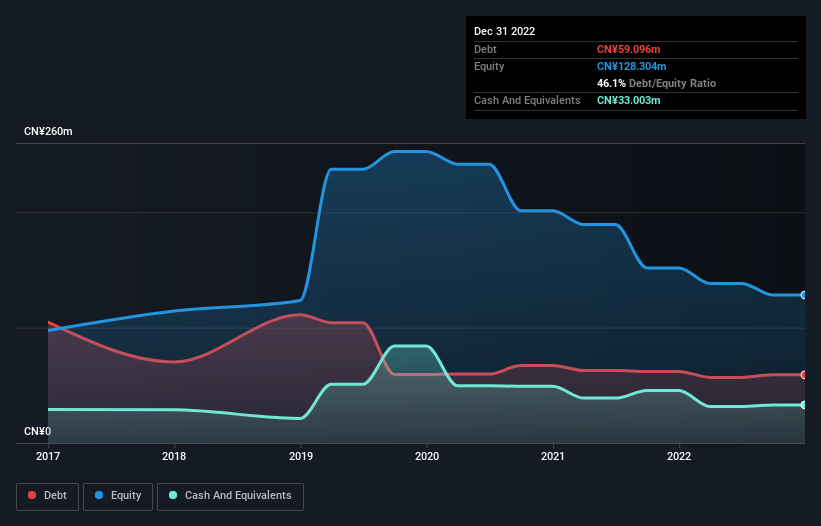
What Is Tu Yi Holding's Net Debt?
You can click the graphic below for the historical numbers, but it shows that Tu Yi Holding had CN¥59.1m of debt in December 2022, down from CN¥62.0m, one year before. However, it does have CN¥33.0m in cash offsetting this, leading to net debt of about CN¥26.1m.
How Strong Is Tu Yi Holding's Balance Sheet?
The latest balance sheet data shows that Tu Yi Holding had liabilities of CN¥44.3m due within a year, and liabilities of CN¥38.2m falling due after that. On the other hand, it had cash of CN¥33.0m and CN¥857.0k worth of receivables due within a year. So its liabilities total CN¥48.6m more than the combination of its cash and short-term receivables.
While this might seem like a lot, it is not so bad since Tu Yi Holding has a market capitalization of CN¥149.8m, and so it could probably strengthen its balance sheet by raising capital if it needed to. However, it is still worthwhile taking a close look at its ability to pay off debt. The balance sheet is clearly the area to focus on when you are analysing debt. But it is Tu Yi Holding's earnings that will influence how the balance sheet holds up in the future. So if you're keen to discover more about its earnings, it might be worth checking out this graph of its long term earnings trend.
In the last year Tu Yi Holding wasn't profitable at an EBIT level, but managed to grow its revenue by 26%, to CN¥26m. Shareholders probably have their fingers crossed that it can grow its way to profits.
Caveat Emptor
Even though Tu Yi Holding managed to grow its top line quite deftly, the cold hard truth is that it is losing money on the EBIT line. To be specific the EBIT loss came in at CN¥13m. Considering that alongside the liabilities mentioned above does not give us much confidence that company should be using so much debt. Quite frankly we think the balance sheet is far from match-fit, although it could be improved with time. For example, we would not want to see a repeat of last year's loss of CN¥18m. So to be blunt we do think it is risky. There's no doubt that we learn most about debt from the balance sheet. But ultimately, every company can contain risks that exist outside of the balance sheet. These risks can be hard to spot. Every company has them, and we've spotted 4 warning signs for Tu Yi Holding (of which 2 can't be ignored!) you should know about.
At the end of the day, it's often better to focus on companies that are free from net debt. You can access our special list of such companies (all with a track record of profit growth). It's free.
Valuation is complex, but we're here to simplify it.
Discover if Tu Yi Holding might be undervalued or overvalued with our detailed analysis, featuring fair value estimates, potential risks, dividends, insider trades, and its financial condition.
Access Free AnalysisHave feedback on this article? Concerned about the content? Get in touch with us directly. Alternatively, email editorial-team (at) simplywallst.com.
This article by Simply Wall St is general in nature. We provide commentary based on historical data and analyst forecasts only using an unbiased methodology and our articles are not intended to be financial advice. It does not constitute a recommendation to buy or sell any stock, and does not take account of your objectives, or your financial situation. We aim to bring you long-term focused analysis driven by fundamental data. Note that our analysis may not factor in the latest price-sensitive company announcements or qualitative material. Simply Wall St has no position in any stocks mentioned.
About SEHK:1701
Tu Yi Holding
An investment holding company, provides outbound travel products and service in the People’s Republic of China and Japan.
Excellent balance sheet with proven track record.
Market Insights

Advertisement
Community Narratives
MINISO's fair value is projected at 26.69 with an anticipated PE ratio shift of 20x
Fair Value US$24.03|9.0% undervalued
BE
Community Contributor
Procter & Gamble: A Dividend Giant Facing Slowing Growth
Fair Value US$119.81|23.5% overvalued
AN
Community Contributor
Eli Lilly's Future Growth Driven by Tirzepatide and Favorable Market Conditions
Fair Value US$1.19k|14.4% undervalued
EA
Community Contributor