
Advertisement
ST International Holdings (HKG:8521) Has A Pretty Healthy Balance Sheet
Legendary fund manager Li Lu (who Charlie Munger backed) once said, 'The biggest investment risk is not the volatility of prices, but whether you will suffer a permanent loss of capital.' It's only natural to consider a company's balance sheet when you examine how risky it is, since debt is often involved when a business collapses. As with many other companies ST International Holdings Company Limited (HKG:8521) makes use of debt. But should shareholders be worried about its use of debt?
What Risk Does Debt Bring?
Generally speaking, debt only becomes a real problem when a company can't easily pay it off, either by raising capital or with its own cash flow. In the worst case scenario, a company can go bankrupt if it cannot pay its creditors. However, a more common (but still painful) scenario is that it has to raise new equity capital at a low price, thus permanently diluting shareholders. Of course, plenty of companies use debt to fund growth, without any negative consequences. When we examine debt levels, we first consider both cash and debt levels, together.
Check out our latest analysis for ST International Holdings
How Much Debt Does ST International Holdings Carry?
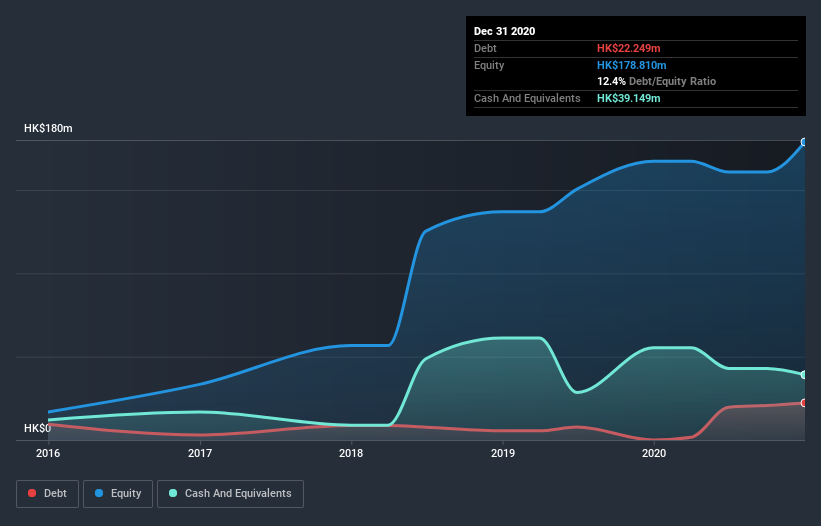
The image below, which you can click on for greater detail, shows that at December 2020 ST International Holdings had debt of HK$22.2m, up from none in one year. But it also has HK$39.1m in cash to offset that, meaning it has HK$16.9m net cash.
How Healthy Is ST International Holdings' Balance Sheet?
The latest balance sheet data shows that ST International Holdings had liabilities of HK$39.3m due within a year, and liabilities of HK$1.65m falling due after that. On the other hand, it had cash of HK$39.1m and HK$80.5m worth of receivables due within a year. So it actually has HK$78.6m more liquid assets than total liabilities.
This surplus liquidity suggests that ST International Holdings' balance sheet could take a hit just as well as Homer Simpson's head can take a punch. With this in mind one could posit that its balance sheet means the company is able to handle some adversity. Succinctly put, ST International Holdings boasts net cash, so it's fair to say it does not have a heavy debt load!
In fact ST International Holdings's saving grace is its low debt levels, because its EBIT has tanked 86% in the last twelve months. When it comes to paying off debt, falling earnings are no more useful than sugary sodas are for your health. When analysing debt levels, the balance sheet is the obvious place to start. But you can't view debt in total isolation; since ST International Holdings will need earnings to service that debt. So if you're keen to discover more about its earnings, it might be worth checking out this graph of its long term earnings trend.
Finally, a business needs free cash flow to pay off debt; accounting profits just don't cut it. While ST International Holdings has net cash on its balance sheet, it's still worth taking a look at its ability to convert earnings before interest and tax (EBIT) to free cash flow, to help us understand how quickly it is building (or eroding) that cash balance. Over the last three years, ST International Holdings saw substantial negative free cash flow, in total. While investors are no doubt expecting a reversal of that situation in due course, it clearly does mean its use of debt is more risky.
Summing up
While we empathize with investors who find debt concerning, the bottom line is that ST International Holdings has net cash of HK$16.9m and plenty of liquid assets. So we don't have any problem with ST International Holdings's use of debt. The balance sheet is clearly the area to focus on when you are analysing debt. However, not all investment risk resides within the balance sheet - far from it. To that end, you should learn about the 3 warning signs we've spotted with ST International Holdings (including 2 which are concerning) .
At the end of the day, it's often better to focus on companies that are free from net debt. You can access our special list of such companies (all with a track record of profit growth). It's free.
If you’re looking to trade ST International Holdings, open an account with the lowest-cost* platform trusted by professionals, Interactive Brokers. Their clients from over 200 countries and territories trade stocks, options, futures, forex, bonds and funds worldwide from a single integrated account. Promoted
Valuation is complex, but we're here to simplify it.
Discover if WebX International Holdings might be undervalued or overvalued with our detailed analysis, featuring fair value estimates, potential risks, dividends, insider trades, and its financial condition.
Access Free AnalysisThis article by Simply Wall St is general in nature. It does not constitute a recommendation to buy or sell any stock, and does not take account of your objectives, or your financial situation. We aim to bring you long-term focused analysis driven by fundamental data. Note that our analysis may not factor in the latest price-sensitive company announcements or qualitative material. Simply Wall St has no position in any stocks mentioned.
*Interactive Brokers Rated Lowest Cost Broker by StockBrokers.com Annual Online Review 2020
Have feedback on this article? Concerned about the content? Get in touch with us directly. Alternatively, email editorial-team (at) simplywallst.com.
About SEHK:8521
WebX International Holdings
An investment holding company, provides functional knitted fabrics in the People's Republic of China and Hong Kong.
Adequate balance sheet with very low risk.
Market Insights

Advertisement
Community Narratives
MicroVision will explode future revenue by 380.37% with a vision towards success
Fair Value US$60|98.4% undervalued
TH
Community Contributor
The Indispensable Artery for a New North American Economy
Fair Value CA$132.87|0.6% undervalued
TI
Community Contributor
Recently Updated Narratives
BL


BlackGoat on Alphabet ·
Alphabet: The Under-appreciated Compounder Hiding in Plain Sight
Fair Value:US$324.481.3% undervalued
75 followersusers have followed this narrative
3 commentsusers have commented on this narrative
1 likeusers have liked this narrative
BE


Bejgal on MINISO Group Holding ·
MINISO's fair value is projected at 26.69 with an anticipated PE ratio shift of 20x
Fair Value:US$26.6926.7% undervalued
44 followersusers have followed this narrative
3 commentsusers have commented on this narrative
0 likesusers have liked this narrative
TI


TickerTickle on Oracle ·
The Quiet Giant That Became AI’s Power Grid
Fair Value:US$389.8147.4% undervalued
9 followersusers have followed this narrative
2 commentsusers have commented on this narrative
0 likesusers have liked this narrative
Popular Narratives
OS

oscargarcia on Alphabet ·
The company that turned a verb into a global necessity and basically runs the modern internet, digital ads, smartphones, maps, and AI.
Fair Value:US$3405.9% undervalued
136 followersusers have followed this narrative
6 commentsusers have commented on this narrative
18 likesusers have liked this narrative
TH

TheWallstreetKing on MicroVision ·
MicroVision will explode future revenue by 380.37% with a vision towards success
Fair Value:US$6098.4% undervalued
89 followersusers have followed this narrative
11 commentsusers have commented on this narrative
18 likesusers have liked this narrative
AN


AnalystConsensusTarget on NVIDIA ·
NVDA: Expanding AI Demand Will Drive Major Data Center Investments Through 2026
Fair Value:US$232.7922.6% undervalued
926 followersusers have followed this narrative
6 commentsusers have commented on this narrative
22 likesusers have liked this narrative