
Advertisement
More Unpleasant Surprises Could Be In Store For Hanvey Group Holdings Limited's (HKG:8219) Shares After Tumbling 28%

Unfortunately for some shareholders, the Hanvey Group Holdings Limited (HKG:8219) share price has dived 28% in the last thirty days, prolonging recent pain. For any long-term shareholders, the last month ends a year to forget by locking in a 58% share price decline.
In spite of the heavy fall in price, you could still be forgiven for feeling indifferent about Hanvey Group Holdings' P/S ratio of 0.2x, since the median price-to-sales (or "P/S") ratio for the Luxury industry in Hong Kong is also close to 0.7x. Although, it's not wise to simply ignore the P/S without explanation as investors may be disregarding a distinct opportunity or a costly mistake.
View our latest analysis for Hanvey Group Holdings
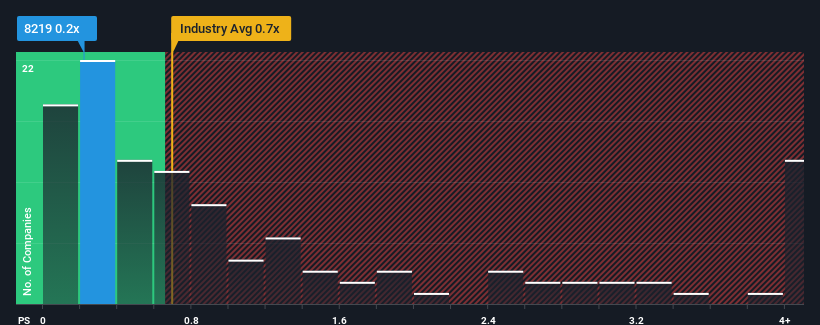
How Hanvey Group Holdings Has Been Performing
As an illustration, revenue has deteriorated at Hanvey Group Holdings over the last year, which is not ideal at all. Perhaps investors believe the recent revenue performance is enough to keep in line with the industry, which is keeping the P/S from dropping off. If not, then existing shareholders may be a little nervous about the viability of the share price.
Although there are no analyst estimates available for Hanvey Group Holdings, take a look at this free data-rich visualisation to see how the company stacks up on earnings, revenue and cash flow.How Is Hanvey Group Holdings' Revenue Growth Trending?
There's an inherent assumption that a company should be matching the industry for P/S ratios like Hanvey Group Holdings' to be considered reasonable.
Retrospectively, the last year delivered a frustrating 32% decrease to the company's top line. However, a few very strong years before that means that it was still able to grow revenue by an impressive 33% in total over the last three years. So we can start by confirming that the company has generally done a very good job of growing revenue over that time, even though it had some hiccups along the way.
This is in contrast to the rest of the industry, which is expected to grow by 13% over the next year, materially higher than the company's recent medium-term annualised growth rates.
With this in mind, we find it intriguing that Hanvey Group Holdings' P/S is comparable to that of its industry peers. Apparently many investors in the company are less bearish than recent times would indicate and aren't willing to let go of their stock right now. They may be setting themselves up for future disappointment if the P/S falls to levels more in line with recent growth rates.
The Final Word
Hanvey Group Holdings' plummeting stock price has brought its P/S back to a similar region as the rest of the industry. Generally, our preference is to limit the use of the price-to-sales ratio to establishing what the market thinks about the overall health of a company.
We've established that Hanvey Group Holdings' average P/S is a bit surprising since its recent three-year growth is lower than the wider industry forecast. Right now we are uncomfortable with the P/S as this revenue performance isn't likely to support a more positive sentiment for long. Unless the recent medium-term conditions improve, it's hard to accept the current share price as fair value.
You should always think about risks. Case in point, we've spotted 2 warning signs for Hanvey Group Holdings you should be aware of, and 1 of them is a bit unpleasant.
If you're unsure about the strength of Hanvey Group Holdings' business, why not explore our interactive list of stocks with solid business fundamentals for some other companies you may have missed.
Valuation is complex, but we're here to simplify it.
Discover if Hanvey Group Holdings might be undervalued or overvalued with our detailed analysis, featuring fair value estimates, potential risks, dividends, insider trades, and its financial condition.
Access Free AnalysisHave feedback on this article? Concerned about the content? Get in touch with us directly. Alternatively, email editorial-team (at) simplywallst.com.
This article by Simply Wall St is general in nature. We provide commentary based on historical data and analyst forecasts only using an unbiased methodology and our articles are not intended to be financial advice. It does not constitute a recommendation to buy or sell any stock, and does not take account of your objectives, or your financial situation. We aim to bring you long-term focused analysis driven by fundamental data. Note that our analysis may not factor in the latest price-sensitive company announcements or qualitative material. Simply Wall St has no position in any stocks mentioned.
About SEHK:8219
Hanvey Group Holdings
An investment holding company, designs, develops, manufactures, and distributes watch products on an original design manufacturing basis in Hong Kong and the People’s Republic of China.
Moderate and slightly overvalued.
Market Insights


Advertisement
Community Narratives
Alphabet: The Under-appreciated Compounder Hiding in Plain Sight
Fair Value US$282.83|31.8% undervalued
BL
Community Contributor
Planet Labs: At The Heart Of The Emerging New Space Boom
Fair Value US$11.31|44.7% undervalued
AN
Community Contributor
Exxon in Guyana 5 year forecast Low $135 to High $189
Fair Value US$174.00|35.8% undervalued
AG
Community Contributor