- Hong Kong
- /
- Consumer Durables
- /
- SEHK:531
Investors five-year losses continue as Samson Holding (HKG:531) dips a further 12% this week, earnings continue to decline


Statistically speaking, long term investing is a profitable endeavour. But unfortunately, some companies simply don't succeed. Zooming in on an example, the Samson Holding Ltd. (HKG:531) share price dropped 64% in the last half decade. That's an unpleasant experience for long term holders. And it's not just long term holders hurting, because the stock is down 44% in the last year. Shareholders have had an even rougher run lately, with the share price down 21% in the last 90 days.
Given the past week has been tough on shareholders, let's investigate the fundamentals and see what we can learn.
See our latest analysis for Samson Holding
There is no denying that markets are sometimes efficient, but prices do not always reflect underlying business performance. One flawed but reasonable way to assess how sentiment around a company has changed is to compare the earnings per share (EPS) with the share price.
Samson Holding became profitable within the last five years. That would generally be considered a positive, so we are surprised to see the share price is down. Other metrics might give us a better handle on how its value is changing over time.
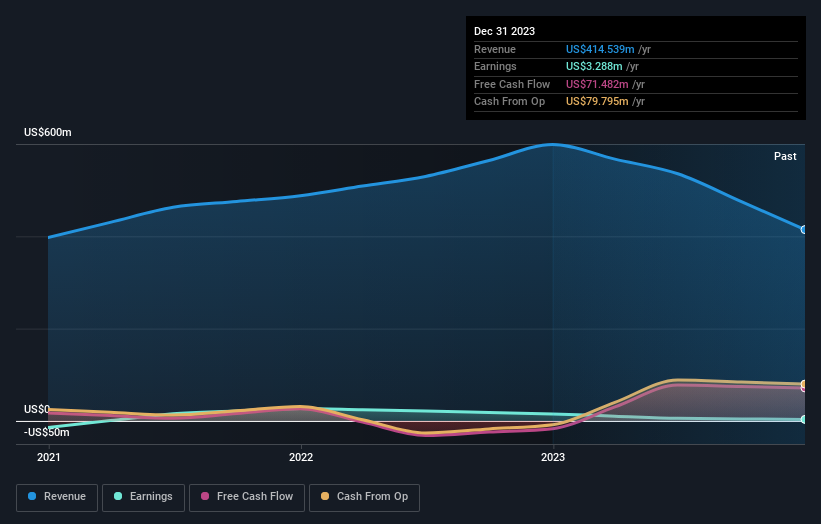
In contrast to the share price, revenue has actually increased by 3.6% a year in the five year period. A more detailed examination of the revenue and earnings may or may not explain why the share price languishes; there could be an opportunity.
The image below shows how earnings and revenue have tracked over time (if you click on the image you can see greater detail).
If you are thinking of buying or selling Samson Holding stock, you should check out this FREE detailed report on its balance sheet.
What About The Total Shareholder Return (TSR)?
We'd be remiss not to mention the difference between Samson Holding's total shareholder return (TSR) and its share price return. Arguably the TSR is a more complete return calculation because it accounts for the value of dividends (as if they were reinvested), along with the hypothetical value of any discounted capital that have been offered to shareholders. Samson Holding's TSR of was a loss of 59% for the 5 years. That wasn't as bad as its share price return, because it has paid dividends.
A Different Perspective
Samson Holding shareholders are down 44% for the year, but the market itself is up 3.2%. Even the share prices of good stocks drop sometimes, but we want to see improvements in the fundamental metrics of a business, before getting too interested. Unfortunately, last year's performance may indicate unresolved challenges, given that it was worse than the annualised loss of 10% over the last half decade. Generally speaking long term share price weakness can be a bad sign, though contrarian investors might want to research the stock in hope of a turnaround. I find it very interesting to look at share price over the long term as a proxy for business performance. But to truly gain insight, we need to consider other information, too. To that end, you should be aware of the 3 warning signs we've spotted with Samson Holding .
If you like to buy stocks alongside management, then you might just love this free list of companies. (Hint: many of them are unnoticed AND have attractive valuation).
Please note, the market returns quoted in this article reflect the market weighted average returns of stocks that currently trade on Hong Kong exchanges.
New: Manage All Your Stock Portfolios in One Place
We've created the ultimate portfolio companion for stock investors, and it's free.
• Connect an unlimited number of Portfolios and see your total in one currency
• Be alerted to new Warning Signs or Risks via email or mobile
• Track the Fair Value of your stocks
Have feedback on this article? Concerned about the content? Get in touch with us directly. Alternatively, email editorial-team (at) simplywallst.com.
This article by Simply Wall St is general in nature. We provide commentary based on historical data and analyst forecasts only using an unbiased methodology and our articles are not intended to be financial advice. It does not constitute a recommendation to buy or sell any stock, and does not take account of your objectives, or your financial situation. We aim to bring you long-term focused analysis driven by fundamental data. Note that our analysis may not factor in the latest price-sensitive company announcements or qualitative material. Simply Wall St has no position in any stocks mentioned.
About SEHK:531
Samson Holding
An investment holding company, designs, manufactures, markets, trades in, and sells residential and commercial furniture in the People’s Republic of China, the United States, and internationally.
Excellent balance sheet and slightly overvalued.

