
Advertisement
China Dongxiang (Group) Co., Ltd. (HKG:3818) Stock Rockets 26% As Investors Are Less Pessimistic Than Expected
China Dongxiang (Group) Co., Ltd. (HKG:3818) shares have continued their recent momentum with a 26% gain in the last month alone. Looking further back, the 12% rise over the last twelve months isn't too bad notwithstanding the strength over the last 30 days.
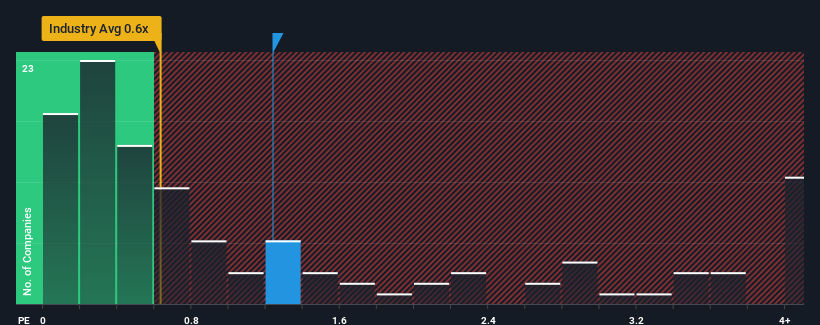
Following the firm bounce in price, given close to half the companies operating in Hong Kong's Luxury industry have price-to-sales ratios (or "P/S") below 0.6x, you may consider China Dongxiang (Group) as a stock to potentially avoid with its 1.2x P/S ratio. Although, it's not wise to just take the P/S at face value as there may be an explanation why it's as high as it is.
Check out our latest analysis for China Dongxiang (Group)
What Does China Dongxiang (Group)'s Recent Performance Look Like?
While the industry has experienced revenue growth lately, China Dongxiang (Group)'s revenue has gone into reverse gear, which is not great. Perhaps the market is expecting the poor revenue to reverse, justifying it's current high P/S.. If not, then existing shareholders may be extremely nervous about the viability of the share price.
Keen to find out how analysts think China Dongxiang (Group)'s future stacks up against the industry? In that case, our free report is a great place to start.Is There Enough Revenue Growth Forecasted For China Dongxiang (Group)?
There's an inherent assumption that a company should outperform the industry for P/S ratios like China Dongxiang (Group)'s to be considered reasonable.
Retrospectively, the last year delivered a frustrating 8.8% decrease to the company's top line. This has soured the latest three-year period, which nevertheless managed to deliver a decent 15% overall rise in revenue. Although it's been a bumpy ride, it's still fair to say the revenue growth recently has been mostly respectable for the company.
Looking ahead now, revenue is anticipated to climb by 11% during the coming year according to the only analyst following the company. That's shaping up to be similar to the 12% growth forecast for the broader industry.
With this information, we find it interesting that China Dongxiang (Group) is trading at a high P/S compared to the industry. It seems most investors are ignoring the fairly average growth expectations and are willing to pay up for exposure to the stock. These shareholders may be setting themselves up for disappointment if the P/S falls to levels more in line with the growth outlook.
What Does China Dongxiang (Group)'s P/S Mean For Investors?
China Dongxiang (Group)'s P/S is on the rise since its shares have risen strongly. It's argued the price-to-sales ratio is an inferior measure of value within certain industries, but it can be a powerful business sentiment indicator.
Analysts are forecasting China Dongxiang (Group)'s revenues to only grow on par with the rest of the industry, which has lead to the high P/S ratio being unexpected. Right now we are uncomfortable with the relatively high share price as the predicted future revenues aren't likely to support such positive sentiment for long. Unless the company can jump ahead of the rest of the industry in the short-term, it'll be a challenge to maintain the share price at current levels.
Having said that, be aware China Dongxiang (Group) is showing 1 warning sign in our investment analysis, you should know about.
Of course, profitable companies with a history of great earnings growth are generally safer bets. So you may wish to see this free collection of other companies that have reasonable P/E ratios and have grown earnings strongly.
New: AI Stock Screener & Alerts
Our new AI Stock Screener scans the market every day to uncover opportunities.
• Dividend Powerhouses (3%+ Yield)
• Undervalued Small Caps with Insider Buying
• High growth Tech and AI Companies
Or build your own from over 50 metrics.
Have feedback on this article? Concerned about the content? Get in touch with us directly. Alternatively, email editorial-team (at) simplywallst.com.
This article by Simply Wall St is general in nature. We provide commentary based on historical data and analyst forecasts only using an unbiased methodology and our articles are not intended to be financial advice. It does not constitute a recommendation to buy or sell any stock, and does not take account of your objectives, or your financial situation. We aim to bring you long-term focused analysis driven by fundamental data. Note that our analysis may not factor in the latest price-sensitive company announcements or qualitative material. Simply Wall St has no position in any stocks mentioned.
About SEHK:3818
China Dongxiang (Group)
Engages in the design, development, marketing, and sale of sport-related apparel, footwear, and accessories in the People’s Republic of China and internationally.
Flawless balance sheet with questionable track record.
Market Insights

Advertisement
Community Narratives
MicroVision will explode future revenue by 380.37% with a vision towards success
Fair Value US$60|98.4% undervalued
TH
Community Contributor
The Indispensable Artery for a New North American Economy
Fair Value CA$132.87|1.6% undervalued
TI
Community Contributor
Recently Updated Narratives
BE


Bejgal on MINISO Group Holding ·
MINISO's fair value is projected at 26.69 with an anticipated PE ratio shift of 20x
Fair Value:US$26.6928.0% undervalued
44 followersusers have followed this narrative
3 commentsusers have commented on this narrative
0 likesusers have liked this narrative
TI


TickerTickle on Oracle ·
The Quiet Giant That Became AI’s Power Grid
Fair Value:US$389.8149.5% undervalued
6 followersusers have followed this narrative
0 commentsusers have commented on this narrative
0 likesusers have liked this narrative
AU

AuCA on Nova Ljubljanska Banka d.d ·
Nova Ljubljanska Banka d.d will expect a 11.2% revenue boost driving future growth
Fair Value:€20916.3% undervalued
23 followersusers have followed this narrative
3 commentsusers have commented on this narrative
0 likesusers have liked this narrative
Popular Narratives
OS


oscargarcia on Alphabet ·
The company that turned a verb into a global necessity and basically runs the modern internet, digital ads, smartphones, maps, and AI.
Fair Value:US$3404.9% undervalued
134 followersusers have followed this narrative
6 commentsusers have commented on this narrative
18 likesusers have liked this narrative
TH

TheWallstreetKing on MicroVision ·
MicroVision will explode future revenue by 380.37% with a vision towards success
Fair Value:US$6098.4% undervalued
82 followersusers have followed this narrative
10 commentsusers have commented on this narrative
18 likesusers have liked this narrative
AN


AnalystConsensusTarget on NVIDIA ·
NVDA: Expanding AI Demand Will Drive Major Data Center Investments Through 2026
Fair Value:US$232.7923.6% undervalued
919 followersusers have followed this narrative
5 commentsusers have commented on this narrative
21 likesusers have liked this narrative