
Advertisement
Some AOM International Group Company Limited (HKG:381) Shareholders Look For Exit As Shares Take 26% Pounding
Unfortunately for some shareholders, the AOM International Group Company Limited (HKG:381) share price has dived 26% in the last thirty days, prolonging recent pain. The recent drop completes a disastrous twelve months for shareholders, who are sitting on a 78% loss during that time.
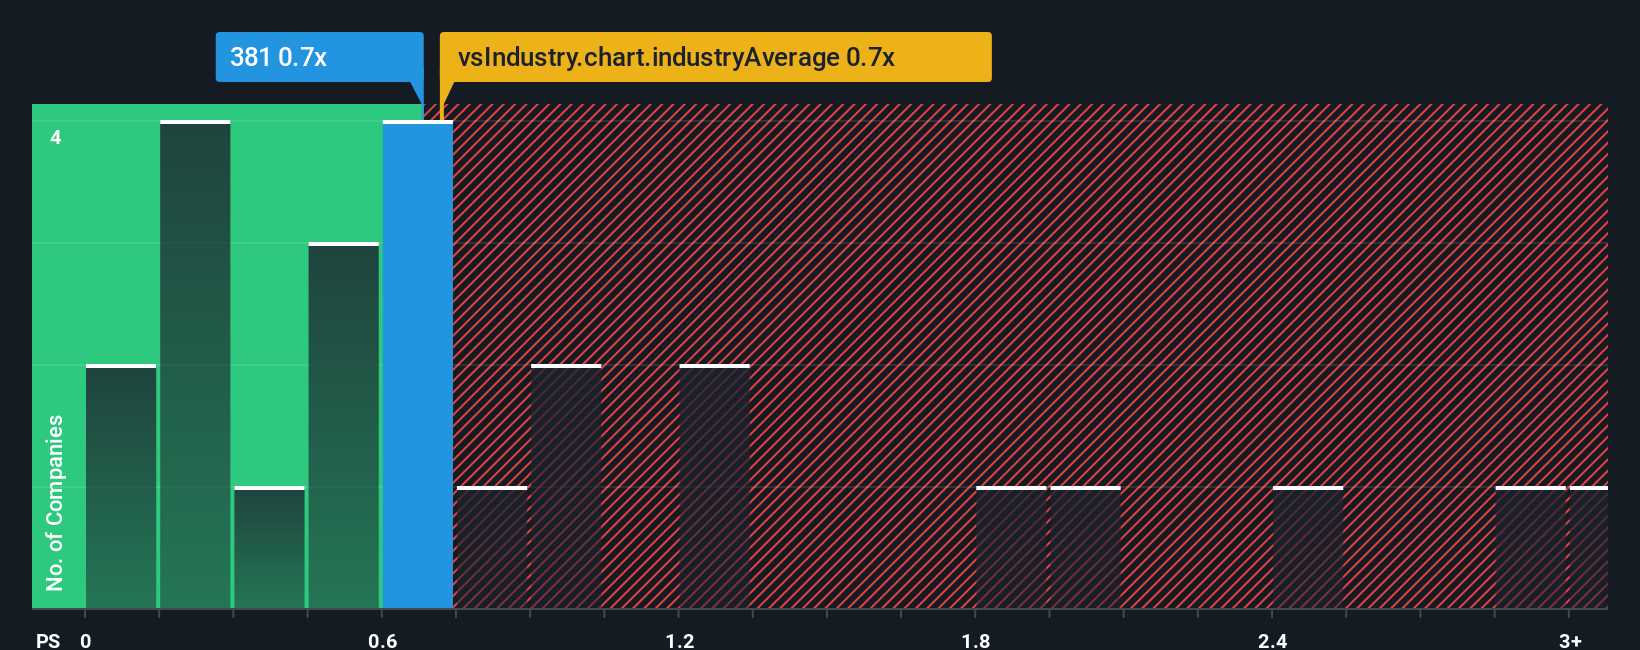
In spite of the heavy fall in price, it's still not a stretch to say that AOM International Group's price-to-sales (or "P/S") ratio of 0.7x right now seems quite "middle-of-the-road" compared to the Leisure industry in Hong Kong, seeing as it matches the P/S ratio of the wider industry. While this might not raise any eyebrows, if the P/S ratio is not justified investors could be missing out on a potential opportunity or ignoring looming disappointment.
View our latest analysis for AOM International Group
What Does AOM International Group's Recent Performance Look Like?
AOM International Group has been doing a good job lately as it's been growing revenue at a solid pace. One possibility is that the P/S is moderate because investors think this respectable revenue growth might not be enough to outperform the broader industry in the near future. Those who are bullish on AOM International Group will be hoping that this isn't the case, so that they can pick up the stock at a lower valuation.
Although there are no analyst estimates available for AOM International Group, take a look at this free data-rich visualisation to see how the company stacks up on earnings, revenue and cash flow.Do Revenue Forecasts Match The P/S Ratio?
AOM International Group's P/S ratio would be typical for a company that's only expected to deliver moderate growth, and importantly, perform in line with the industry.
Taking a look back first, we see that the company grew revenue by an impressive 19% last year. Still, revenue has barely risen at all from three years ago in total, which is not ideal. So it appears to us that the company has had a mixed result in terms of growing revenue over that time.
Comparing that to the industry, which is predicted to deliver 10% growth in the next 12 months, the company's momentum is weaker, based on recent medium-term annualised revenue results.
With this information, we find it interesting that AOM International Group is trading at a fairly similar P/S compared to the industry. Apparently many investors in the company are less bearish than recent times would indicate and aren't willing to let go of their stock right now. Maintaining these prices will be difficult to achieve as a continuation of recent revenue trends is likely to weigh down the shares eventually.
What We Can Learn From AOM International Group's P/S?
Following AOM International Group's share price tumble, its P/S is just clinging on to the industry median P/S. It's argued the price-to-sales ratio is an inferior measure of value within certain industries, but it can be a powerful business sentiment indicator.
We've established that AOM International Group's average P/S is a bit surprising since its recent three-year growth is lower than the wider industry forecast. Right now we are uncomfortable with the P/S as this revenue performance isn't likely to support a more positive sentiment for long. Unless there is a significant improvement in the company's medium-term performance, it will be difficult to prevent the P/S ratio from declining to a more reasonable level.
And what about other risks? Every company has them, and we've spotted 3 warning signs for AOM International Group you should know about.
If you're unsure about the strength of AOM International Group's business, why not explore our interactive list of stocks with solid business fundamentals for some other companies you may have missed.
New: Manage All Your Stock Portfolios in One Place
We've created the ultimate portfolio companion for stock investors, and it's free.
• Connect an unlimited number of Portfolios and see your total in one currency
• Be alerted to new Warning Signs or Risks via email or mobile
• Track the Fair Value of your stocks
Have feedback on this article? Concerned about the content? Get in touch with us directly. Alternatively, email editorial-team (at) simplywallst.com.
This article by Simply Wall St is general in nature. We provide commentary based on historical data and analyst forecasts only using an unbiased methodology and our articles are not intended to be financial advice. It does not constitute a recommendation to buy or sell any stock, and does not take account of your objectives, or your financial situation. We aim to bring you long-term focused analysis driven by fundamental data. Note that our analysis may not factor in the latest price-sensitive company announcements or qualitative material. Simply Wall St has no position in any stocks mentioned.
About SEHK:381
AOM International Group
An investment holding company, manufactures and trades in toys and gifts in the People's Republic of China, the United States, Canada, Samoa, and internationally.
Mediocre balance sheet with low risk.
Market Insights

Advertisement
Community Narratives
MicroVision will explode future revenue by 380.37% with a vision towards success
Fair Value US$60|98.4% undervalued
TH
Community Contributor
The Indispensable Artery for a New North American Economy
Fair Value CA$132.87|0.8% undervalued
TI
Community Contributor
Recently Updated Narratives
MA


MarkoVT on COVER ·
Q3 Outlook modestly optimistic
Fair Value:JP¥1.65k2.0% overvalued
1 followerusers have followed this narrative
0 commentsusers have commented on this narrative
0 likesusers have liked this narrative
BL


BlackGoat on Alphabet ·
Alphabet: The Under-appreciated Compounder Hiding in Plain Sight
Fair Value:US$324.481.3% undervalued
80 followersusers have followed this narrative
3 commentsusers have commented on this narrative
2 likesusers have liked this narrative
BE


Bejgal on MINISO Group Holding ·
MINISO's fair value is projected at 26.69 with an anticipated PE ratio shift of 20x
Fair Value:US$26.6926.7% undervalued
46 followersusers have followed this narrative
3 commentsusers have commented on this narrative
0 likesusers have liked this narrative
Popular Narratives
OS

oscargarcia on Alphabet ·
The company that turned a verb into a global necessity and basically runs the modern internet, digital ads, smartphones, maps, and AI.
Fair Value:US$3405.9% undervalued
136 followersusers have followed this narrative
6 commentsusers have commented on this narrative
18 likesusers have liked this narrative
TH

TheWallstreetKing on MicroVision ·
MicroVision will explode future revenue by 380.37% with a vision towards success
Fair Value:US$6098.4% undervalued
92 followersusers have followed this narrative
10 commentsusers have commented on this narrative
18 likesusers have liked this narrative
AN


AnalystConsensusTarget on NVIDIA ·
NVDA: Expanding AI Demand Will Drive Major Data Center Investments Through 2026
Fair Value:US$232.7922.6% undervalued
927 followersusers have followed this narrative
6 commentsusers have commented on this narrative
22 likesusers have liked this narrative