It's A Story Of Risk Vs Reward With Billion Industrial Holdings Limited (HKG:2299)

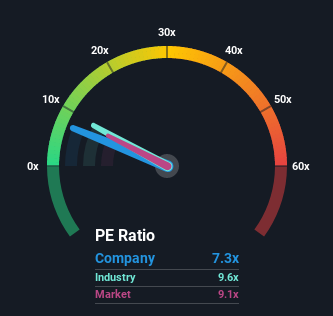
With a median price-to-earnings (or "P/E") ratio of close to 9x in Hong Kong, you could be forgiven for feeling indifferent about Billion Industrial Holdings Limited's (HKG:2299) P/E ratio of 7.3x. While this might not raise any eyebrows, if the P/E ratio is not justified investors could be missing out on a potential opportunity or ignoring looming disappointment.
Recent times have been quite advantageous for Billion Industrial Holdings as its earnings have been rising very briskly. The P/E is probably moderate because investors think this strong earnings growth might not be enough to outperform the broader market in the near future. If you like the company, you'd be hoping this isn't the case so that you could potentially pick up some stock while it's not quite in favour.
View our latest analysis for Billion Industrial Holdings

What Are Growth Metrics Telling Us About The P/E?
Billion Industrial Holdings' P/E ratio would be typical for a company that's only expected to deliver moderate growth, and importantly, perform in line with the market.
Retrospectively, the last year delivered an exceptional 107% gain to the company's bottom line. The latest three year period has also seen an excellent 117% overall rise in EPS, aided by its short-term performance. Therefore, it's fair to say the earnings growth recently has been superb for the company.
Comparing that to the market, which is only predicted to deliver 18% growth in the next 12 months, the company's momentum is stronger based on recent medium-term annualised earnings results.
With this information, we find it interesting that Billion Industrial Holdings is trading at a fairly similar P/E to the market. It may be that most investors are not convinced the company can maintain its recent growth rates.
The Key Takeaway
Using the price-to-earnings ratio alone to determine if you should sell your stock isn't sensible, however it can be a practical guide to the company's future prospects.
We've established that Billion Industrial Holdings currently trades on a lower than expected P/E since its recent three-year growth is higher than the wider market forecast. There could be some unobserved threats to earnings preventing the P/E ratio from matching this positive performance. At least the risk of a price drop looks to be subdued if recent medium-term earnings trends continue, but investors seem to think future earnings could see some volatility.
Many other vital risk factors can be found on the company's balance sheet. Our free balance sheet analysis for Billion Industrial Holdings with six simple checks will allow you to discover any risks that could be an issue.
Of course, you might also be able to find a better stock than Billion Industrial Holdings. So you may wish to see this free collection of other companies that sit on P/E's below 20x and have grown earnings strongly.
Valuation is complex, but we're here to simplify it.
Discover if Billion Industrial Holdings might be undervalued or overvalued with our detailed analysis, featuring fair value estimates, potential risks, dividends, insider trades, and its financial condition.
Access Free AnalysisHave feedback on this article? Concerned about the content? Get in touch with us directly. Alternatively, email editorial-team (at) simplywallst.com.
This article by Simply Wall St is general in nature. We provide commentary based on historical data and analyst forecasts only using an unbiased methodology and our articles are not intended to be financial advice. It does not constitute a recommendation to buy or sell any stock, and does not take account of your objectives, or your financial situation. We aim to bring you long-term focused analysis driven by fundamental data. Note that our analysis may not factor in the latest price-sensitive company announcements or qualitative material. Simply Wall St has no position in any stocks mentioned.
About SEHK:2299
Billion Industrial Holdings
Engages in manufacturing and sales of polyester filament yarns, polyester, polyester industrial yarns, and ES fiber products in the People’s Republic of China and internationally.
Excellent balance sheet with proven track record.
Market Insights
Community Narratives


