
Advertisement
Prada S.p.A.'s (HKG:1913) Popularity With Investors Under Threat As Stock Sinks 30%
Prada S.p.A. (HKG:1913) shareholders that were waiting for something to happen have been dealt a blow with a 30% share price drop in the last month. Instead of being rewarded, shareholders who have already held through the last twelve months are now sitting on a 25% share price drop.
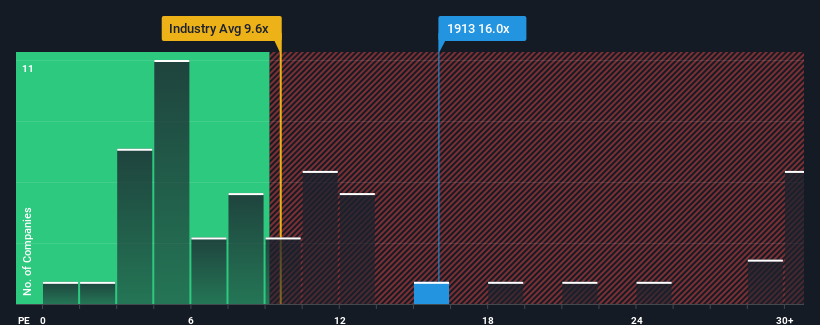
In spite of the heavy fall in price, Prada may still be sending bearish signals at the moment with its price-to-earnings (or "P/E") ratio of 16x, since almost half of all companies in Hong Kong have P/E ratios under 10x and even P/E's lower than 6x are not unusual. Nonetheless, we'd need to dig a little deeper to determine if there is a rational basis for the elevated P/E.
With earnings growth that's superior to most other companies of late, Prada has been doing relatively well. It seems that many are expecting the strong earnings performance to persist, which has raised the P/E. You'd really hope so, otherwise you're paying a pretty hefty price for no particular reason.
See our latest analysis for Prada
What Are Growth Metrics Telling Us About The High P/E?
There's an inherent assumption that a company should outperform the market for P/E ratios like Prada's to be considered reasonable.
If we review the last year of earnings growth, the company posted a terrific increase of 25%. Pleasingly, EPS has also lifted 185% in aggregate from three years ago, thanks to the last 12 months of growth. So we can start by confirming that the company has done a great job of growing earnings over that time.
Looking ahead now, EPS is anticipated to climb by 13% per year during the coming three years according to the analysts following the company. That's shaping up to be similar to the 14% per annum growth forecast for the broader market.
With this information, we find it interesting that Prada is trading at a high P/E compared to the market. It seems most investors are ignoring the fairly average growth expectations and are willing to pay up for exposure to the stock. Although, additional gains will be difficult to achieve as this level of earnings growth is likely to weigh down the share price eventually.
The Bottom Line On Prada's P/E
Despite the recent share price weakness, Prada's P/E remains higher than most other companies. Generally, our preference is to limit the use of the price-to-earnings ratio to establishing what the market thinks about the overall health of a company.
Our examination of Prada's analyst forecasts revealed that its market-matching earnings outlook isn't impacting its high P/E as much as we would have predicted. Right now we are uncomfortable with the relatively high share price as the predicted future earnings aren't likely to support such positive sentiment for long. This places shareholders' investments at risk and potential investors in danger of paying an unnecessary premium.
Having said that, be aware Prada is showing 1 warning sign in our investment analysis, you should know about.
If you're unsure about the strength of Prada's business, why not explore our interactive list of stocks with solid business fundamentals for some other companies you may have missed.
New: Manage All Your Stock Portfolios in One Place
We've created the ultimate portfolio companion for stock investors, and it's free.
• Connect an unlimited number of Portfolios and see your total in one currency
• Be alerted to new Warning Signs or Risks via email or mobile
• Track the Fair Value of your stocks
Have feedback on this article? Concerned about the content? Get in touch with us directly. Alternatively, email editorial-team (at) simplywallst.com.
This article by Simply Wall St is general in nature. We provide commentary based on historical data and analyst forecasts only using an unbiased methodology and our articles are not intended to be financial advice. It does not constitute a recommendation to buy or sell any stock, and does not take account of your objectives, or your financial situation. We aim to bring you long-term focused analysis driven by fundamental data. Note that our analysis may not factor in the latest price-sensitive company announcements or qualitative material. Simply Wall St has no position in any stocks mentioned.
About SEHK:1913
Prada
Produces and distributes leather goods, footwear, and ready to wear products worldwide.
Excellent balance sheet with proven track record and pays a dividend.
Market Insights

Advertisement
Community Narratives
MicroVision will explode future revenue by 380.37% with a vision towards success
Fair Value US$60.00|98.4% undervalued
TH
Community Contributor
The Indispensable Artery for a New North American Economy
Fair Value CA$132.87|1.3% undervalued
TI
Community Contributor