The past five-year earnings decline for Chow Sang Sang Holdings International (HKG:116) likely explains shareholders long-term losses


While not a mind-blowing move, it is good to see that the Chow Sang Sang Holdings International Limited (HKG:116) share price has gained 11% in the last three months. It's not great that the stock is down 22% over the last five years. But on the other hand, that beats the market return of 7.5%.
On a more encouraging note the company has added HK$569m to its market cap in just the last 7 days, so let's see if we can determine what's driven the five-year loss for shareholders.
Check out our latest analysis for Chow Sang Sang Holdings International
To quote Buffett, 'Ships will sail around the world but the Flat Earth Society will flourish. There will continue to be wide discrepancies between price and value in the marketplace...' One flawed but reasonable way to assess how sentiment around a company has changed is to compare the earnings per share (EPS) with the share price.
During the five years over which the share price declined, Chow Sang Sang Holdings International's earnings per share (EPS) dropped by 5.2% each year. This change in EPS is reasonably close to the 5% average annual decrease in the share price. This suggests that market participants have not changed their view of the company all that much. Rather, the share price change has reflected changes in earnings per share.
You can see below how EPS has changed over time (discover the exact values by clicking on the image).
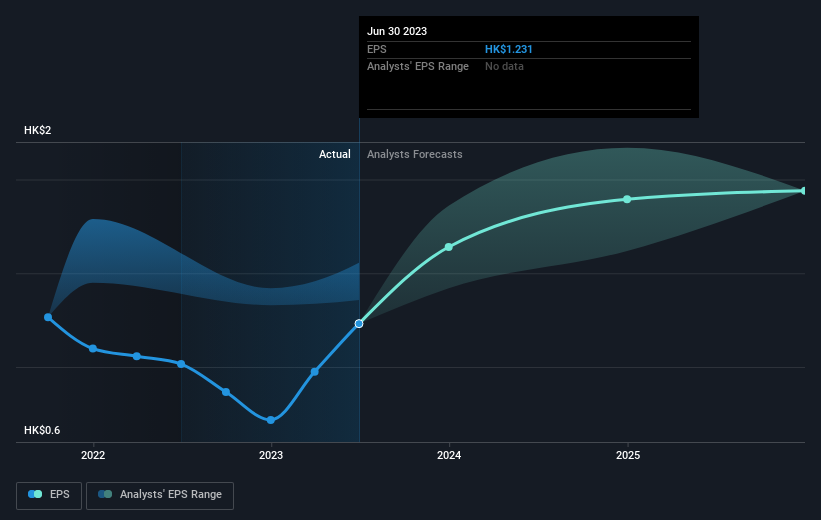
It is of course excellent to see how Chow Sang Sang Holdings International has grown profits over the years, but the future is more important for shareholders. Take a more thorough look at Chow Sang Sang Holdings International's financial health with this free report on its balance sheet.
What About Dividends?
It is important to consider the total shareholder return, as well as the share price return, for any given stock. Whereas the share price return only reflects the change in the share price, the TSR includes the value of dividends (assuming they were reinvested) and the benefit of any discounted capital raising or spin-off. Arguably, the TSR gives a more comprehensive picture of the return generated by a stock. As it happens, Chow Sang Sang Holdings International's TSR for the last 5 years was -2.8%, which exceeds the share price return mentioned earlier. The dividends paid by the company have thusly boosted the total shareholder return.
A Different Perspective
We regret to report that Chow Sang Sang Holdings International shareholders are down 8.0% for the year (even including dividends). Unfortunately, that's worse than the broader market decline of 6.6%. Having said that, it's inevitable that some stocks will be oversold in a falling market. The key is to keep your eyes on the fundamental developments. Unfortunately, last year's performance may indicate unresolved challenges, given that it was worse than the annualised loss of 0.6% over the last half decade. We realise that Baron Rothschild has said investors should "buy when there is blood on the streets", but we caution that investors should first be sure they are buying a high quality business. I find it very interesting to look at share price over the long term as a proxy for business performance. But to truly gain insight, we need to consider other information, too. Case in point: We've spotted 1 warning sign for Chow Sang Sang Holdings International you should be aware of.
If you would prefer to check out another company -- one with potentially superior financials -- then do not miss this free list of companies that have proven they can grow earnings.
Please note, the market returns quoted in this article reflect the market weighted average returns of stocks that currently trade on Hong Kong exchanges.
New: AI Stock Screener & Alerts
Our new AI Stock Screener scans the market every day to uncover opportunities.
• Dividend Powerhouses (3%+ Yield)
• Undervalued Small Caps with Insider Buying
• High growth Tech and AI Companies
Or build your own from over 50 metrics.
Have feedback on this article? Concerned about the content? Get in touch with us directly. Alternatively, email editorial-team (at) simplywallst.com.
This article by Simply Wall St is general in nature. We provide commentary based on historical data and analyst forecasts only using an unbiased methodology and our articles are not intended to be financial advice. It does not constitute a recommendation to buy or sell any stock, and does not take account of your objectives, or your financial situation. We aim to bring you long-term focused analysis driven by fundamental data. Note that our analysis may not factor in the latest price-sensitive company announcements or qualitative material. Simply Wall St has no position in any stocks mentioned.
About SEHK:116
Chow Sang Sang Holdings International
An investment holding company, manufactures and retails jewellery.
Undervalued with excellent balance sheet and pays a dividend.
