
Advertisement
- Hong Kong
- /
- Commercial Services
- /
- SEHK:8309
We Like These Underlying Return On Capital Trends At Man Shing Global Holdings (HKG:8309)
If you're not sure where to start when looking for the next multi-bagger, there are a few key trends you should keep an eye out for. One common approach is to try and find a company with returns on capital employed (ROCE) that are increasing, in conjunction with a growing amount of capital employed. Basically this means that a company has profitable initiatives that it can continue to reinvest in, which is a trait of a compounding machine. So when we looked at Man Shing Global Holdings (HKG:8309) and its trend of ROCE, we really liked what we saw.
Understanding Return On Capital Employed (ROCE)
For those that aren't sure what ROCE is, it measures the amount of pre-tax profits a company can generate from the capital employed in its business. To calculate this metric for Man Shing Global Holdings, this is the formula:
Return on Capital Employed = Earnings Before Interest and Tax (EBIT) ÷ (Total Assets - Current Liabilities)
0.13 = HK$22m ÷ (HK$346m - HK$169m) (Based on the trailing twelve months to March 2024).
Therefore, Man Shing Global Holdings has an ROCE of 13%. In absolute terms, that's a satisfactory return, but compared to the Commercial Services industry average of 7.2% it's much better.
See our latest analysis for Man Shing Global Holdings
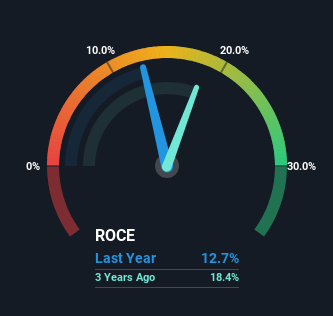
Historical performance is a great place to start when researching a stock so above you can see the gauge for Man Shing Global Holdings' ROCE against it's prior returns. If you'd like to look at how Man Shing Global Holdings has performed in the past in other metrics, you can view this free graph of Man Shing Global Holdings' past earnings, revenue and cash flow.
So How Is Man Shing Global Holdings' ROCE Trending?
Investors would be pleased with what's happening at Man Shing Global Holdings. The numbers show that in the last five years, the returns generated on capital employed have grown considerably to 13%. The company is effectively making more money per dollar of capital used, and it's worth noting that the amount of capital has increased too, by 146%. This can indicate that there's plenty of opportunities to invest capital internally and at ever higher rates, a combination that's common among multi-baggers.
On a side note, Man Shing Global Holdings' current liabilities are still rather high at 49% of total assets. This can bring about some risks because the company is basically operating with a rather large reliance on its suppliers or other sorts of short-term creditors. Ideally we'd like to see this reduce as that would mean fewer obligations bearing risks.
Our Take On Man Shing Global Holdings' ROCE
To sum it up, Man Shing Global Holdings has proven it can reinvest in the business and generate higher returns on that capital employed, which is terrific. Astute investors may have an opportunity here because the stock has declined 32% in the last five years. That being the case, research into the company's current valuation metrics and future prospects seems fitting.
Since virtually every company faces some risks, it's worth knowing what they are, and we've spotted 2 warning signs for Man Shing Global Holdings (of which 1 doesn't sit too well with us!) that you should know about.
While Man Shing Global Holdings isn't earning the highest return, check out this free list of companies that are earning high returns on equity with solid balance sheets.
New: Manage All Your Stock Portfolios in One Place
We've created the ultimate portfolio companion for stock investors, and it's free.
• Connect an unlimited number of Portfolios and see your total in one currency
• Be alerted to new Warning Signs or Risks via email or mobile
• Track the Fair Value of your stocks
Have feedback on this article? Concerned about the content? Get in touch with us directly. Alternatively, email editorial-team (at) simplywallst.com.
This article by Simply Wall St is general in nature. We provide commentary based on historical data and analyst forecasts only using an unbiased methodology and our articles are not intended to be financial advice. It does not constitute a recommendation to buy or sell any stock, and does not take account of your objectives, or your financial situation. We aim to bring you long-term focused analysis driven by fundamental data. Note that our analysis may not factor in the latest price-sensitive company announcements or qualitative material. Simply Wall St has no position in any stocks mentioned.
About SEHK:8309
Man Shing Global Holdings
An investment holding company, provides environmental cleaning and property management services in Hong Kong.
Adequate balance sheet and slightly overvalued.
Market Insights

Advertisement
Community Narratives
The "Molecular Pencil": Why Beam's Technology is Built to Win
Fair Value US$65.01|65.4% undervalued
DA
Community Contributor
The silent giant behind virtually every advanced chip powering AI, smartphones, and modern infrastructure.
Fair Value US$310.00|6.1% undervalued
OS
Community Contributor
ADP Stock: Solid Fundamentals, But AI Investments Test Its Margin Resilience
Fair Value US$387.77|34.2% undervalued
YI
Community Contributor
MINISO's fair value is projected at 26.69 with an anticipated PE ratio shift of 20x
Fair Value US$24.03|9.6% undervalued
BE
Community Contributor