
Advertisement
- Hong Kong
- /
- Commercial Services
- /
- SEHK:8027
It's Down 26% But KPM Holding Limited (HKG:8027) Could Be Riskier Than It Looks
KPM Holding Limited (HKG:8027) shareholders won't be pleased to see that the share price has had a very rough month, dropping 26% and undoing the prior period's positive performance. Indeed, the recent drop has reduced its annual gain to a relatively sedate 4.7% over the last twelve months.
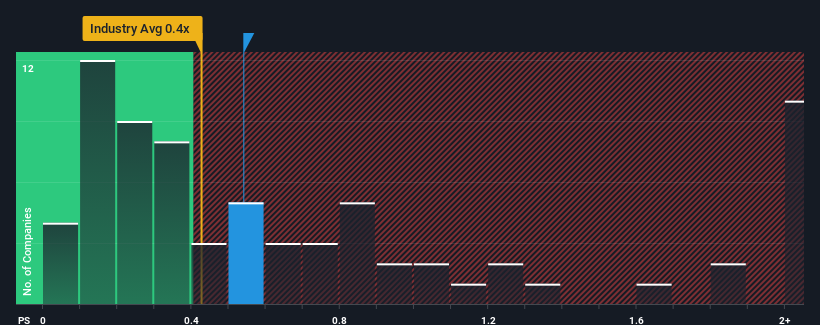
Even after such a large drop in price, there still wouldn't be many who think KPM Holding's price-to-sales (or "P/S") ratio of 0.5x is worth a mention when the median P/S in Hong Kong's Commercial Services industry is similar at about 0.4x. While this might not raise any eyebrows, if the P/S ratio is not justified investors could be missing out on a potential opportunity or ignoring looming disappointment.
View our latest analysis for KPM Holding
What Does KPM Holding's Recent Performance Look Like?
For example, consider that KPM Holding's financial performance has been poor lately as its revenue has been in decline. It might be that many expect the company to put the disappointing revenue performance behind them over the coming period, which has kept the P/S from falling. If you like the company, you'd at least be hoping this is the case so that you could potentially pick up some stock while it's not quite in favour.
Want the full picture on earnings, revenue and cash flow for the company? Then our free report on KPM Holding will help you shine a light on its historical performance.What Are Revenue Growth Metrics Telling Us About The P/S?
KPM Holding's P/S ratio would be typical for a company that's only expected to deliver moderate growth, and importantly, perform in line with the industry.
Retrospectively, the last year delivered a frustrating 51% decrease to the company's top line. Still, the latest three year period has seen an excellent 177% overall rise in revenue, in spite of its unsatisfying short-term performance. Although it's been a bumpy ride, it's still fair to say the revenue growth recently has been more than adequate for the company.
Comparing that recent medium-term revenue trajectory with the industry's one-year growth forecast of 6.9% shows it's noticeably more attractive.
In light of this, it's curious that KPM Holding's P/S sits in line with the majority of other companies. Apparently some shareholders believe the recent performance is at its limits and have been accepting lower selling prices.
The Final Word
KPM Holding's plummeting stock price has brought its P/S back to a similar region as the rest of the industry. It's argued the price-to-sales ratio is an inferior measure of value within certain industries, but it can be a powerful business sentiment indicator.
We've established that KPM Holding currently trades on a lower than expected P/S since its recent three-year growth is higher than the wider industry forecast. When we see strong revenue with faster-than-industry growth, we can only assume potential risks are what might be placing pressure on the P/S ratio. While recent revenue trends over the past medium-term suggest that the risk of a price decline is low, investors appear to see the likelihood of revenue fluctuations in the future.
Don't forget that there may be other risks. For instance, we've identified 3 warning signs for KPM Holding that you should be aware of.
If these risks are making you reconsider your opinion on KPM Holding, explore our interactive list of high quality stocks to get an idea of what else is out there.
Valuation is complex, but we're here to simplify it.
Discover if KPM Holding might be undervalued or overvalued with our detailed analysis, featuring fair value estimates, potential risks, dividends, insider trades, and its financial condition.
Access Free AnalysisHave feedback on this article? Concerned about the content? Get in touch with us directly. Alternatively, email editorial-team (at) simplywallst.com.
This article by Simply Wall St is general in nature. We provide commentary based on historical data and analyst forecasts only using an unbiased methodology and our articles are not intended to be financial advice. It does not constitute a recommendation to buy or sell any stock, and does not take account of your objectives, or your financial situation. We aim to bring you long-term focused analysis driven by fundamental data. Note that our analysis may not factor in the latest price-sensitive company announcements or qualitative material. Simply Wall St has no position in any stocks mentioned.
About SEHK:8027
KPM Holding
An investment holding company, engages in the design, fabrication, installation, and maintenance of signage and related products in Singapore and the People’s Republic of China.
Flawless balance sheet and slightly overvalued.
Market Insights

Advertisement
Community Narratives
MINISO's fair value is projected at 26.69 with an anticipated PE ratio shift of 20x
Fair Value US$24.03|11.0% undervalued
BE
Community Contributor
Procter & Gamble: A Dividend Giant Facing Slowing Growth
Fair Value US$119.81|23.3% overvalued
AN
Community Contributor
Eli Lilly's Future Growth Driven by Tirzepatide and Favorable Market Conditions
Fair Value US$1.19k|13.8% undervalued
EA
Community Contributor