
Advertisement
- Hong Kong
- /
- Commercial Services
- /
- SEHK:1884
eprint Group Limited (HKG:1884) Stock Rockets 32% As Investors Are Less Pessimistic Than Expected

eprint Group Limited (HKG:1884) shareholders would be excited to see that the share price has had a great month, posting a 32% gain and recovering from prior weakness. Unfortunately, the gains of the last month did little to right the losses of the last year with the stock still down 31% over that time.
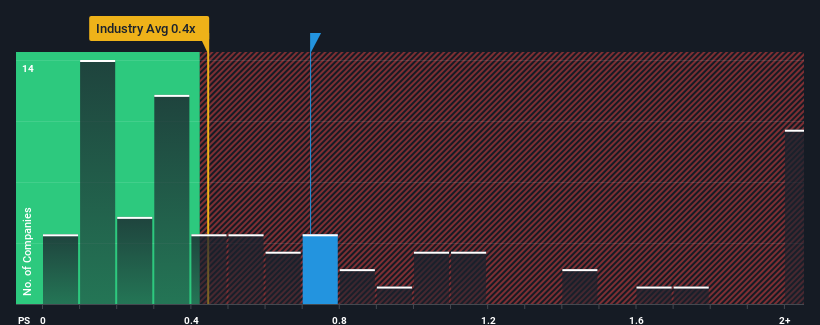
Although its price has surged higher, you could still be forgiven for feeling indifferent about eprint Group's P/S ratio of 0.7x, since the median price-to-sales (or "P/S") ratio for the Commercial Services industry in Hong Kong is also close to 0.4x. Although, it's not wise to simply ignore the P/S without explanation as investors may be disregarding a distinct opportunity or a costly mistake.
Check out our latest analysis for eprint Group
How Has eprint Group Performed Recently?
The recent revenue growth at eprint Group would have to be considered satisfactory if not spectacular. Perhaps the expectation moving forward is that the revenue growth will track in line with the wider industry for the near term, which has kept the P/S subdued. If you like the company, you'd be hoping this isn't the case so that you could potentially pick up some stock while it's not quite in favour.
Although there are no analyst estimates available for eprint Group, take a look at this free data-rich visualisation to see how the company stacks up on earnings, revenue and cash flow.Is There Some Revenue Growth Forecasted For eprint Group?
In order to justify its P/S ratio, eprint Group would need to produce growth that's similar to the industry.
Taking a look back first, we see that the company managed to grow revenues by a handy 4.6% last year. The latest three year period has also seen a 9.7% overall rise in revenue, aided somewhat by its short-term performance. Accordingly, shareholders would have probably been satisfied with the medium-term rates of revenue growth.
This is in contrast to the rest of the industry, which is expected to grow by 7.5% over the next year, materially higher than the company's recent medium-term annualised growth rates.
In light of this, it's curious that eprint Group's P/S sits in line with the majority of other companies. It seems most investors are ignoring the fairly limited recent growth rates and are willing to pay up for exposure to the stock. They may be setting themselves up for future disappointment if the P/S falls to levels more in line with recent growth rates.
The Final Word
eprint Group appears to be back in favour with a solid price jump bringing its P/S back in line with other companies in the industry Generally, our preference is to limit the use of the price-to-sales ratio to establishing what the market thinks about the overall health of a company.
We've established that eprint Group's average P/S is a bit surprising since its recent three-year growth is lower than the wider industry forecast. Right now we are uncomfortable with the P/S as this revenue performance isn't likely to support a more positive sentiment for long. If recent medium-term revenue trends continue, the probability of a share price decline will become quite substantial, placing shareholders at risk.
It's always necessary to consider the ever-present spectre of investment risk. We've identified 2 warning signs with eprint Group (at least 1 which is potentially serious), and understanding these should be part of your investment process.
If companies with solid past earnings growth is up your alley, you may wish to see this free collection of other companies with strong earnings growth and low P/E ratios.
New: Manage All Your Stock Portfolios in One Place
We've created the ultimate portfolio companion for stock investors, and it's free.
• Connect an unlimited number of Portfolios and see your total in one currency
• Be alerted to new Warning Signs or Risks via email or mobile
• Track the Fair Value of your stocks
Have feedback on this article? Concerned about the content? Get in touch with us directly. Alternatively, email editorial-team (at) simplywallst.com.
This article by Simply Wall St is general in nature. We provide commentary based on historical data and analyst forecasts only using an unbiased methodology and our articles are not intended to be financial advice. It does not constitute a recommendation to buy or sell any stock, and does not take account of your objectives, or your financial situation. We aim to bring you long-term focused analysis driven by fundamental data. Note that our analysis may not factor in the latest price-sensitive company announcements or qualitative material. Simply Wall St has no position in any stocks mentioned.
About SEHK:1884
eprint Group
An investment holding company, provides printing services and solutions on advertisements, bound books, and stationeries in Hong Kong.
Mediocre balance sheet and slightly overvalued.
Market Insights


Advertisement
Community Narratives
Alphabet: The Under-appreciated Compounder Hiding in Plain Sight
Fair Value US$282.83|31.8% undervalued
BL
Community Contributor
Planet Labs: At The Heart Of The Emerging New Space Boom
Fair Value US$11.31|44.7% undervalued
AN
Community Contributor
Exxon in Guyana 5 year forecast Low $135 to High $189
Fair Value US$189.00|40.9% undervalued
AG
Community Contributor