
Advertisement
- Hong Kong
- /
- Commercial Services
- /
- SEHK:1850
HSC Resources Group Limited (HKG:1850) Stock's 35% Dive Might Signal An Opportunity But It Requires Some Scrutiny
HSC Resources Group Limited (HKG:1850) shareholders that were waiting for something to happen have been dealt a blow with a 35% share price drop in the last month. The recent drop completes a disastrous twelve months for shareholders, who are sitting on a 60% loss during that time.
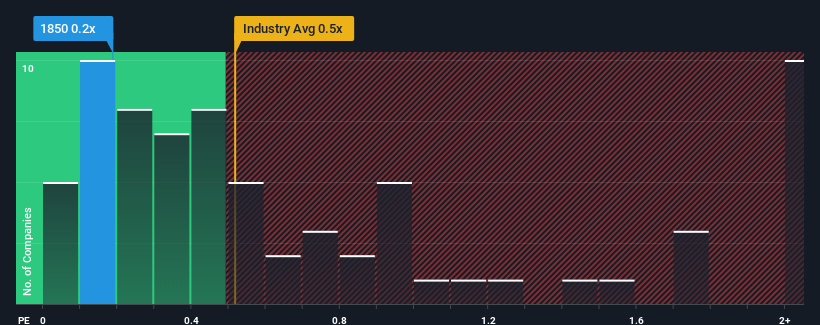
Even after such a large drop in price, there still wouldn't be many who think HSC Resources Group's price-to-sales (or "P/S") ratio of 0.2x is worth a mention when the median P/S in Hong Kong's Commercial Services industry is similar at about 0.5x. Although, it's not wise to simply ignore the P/S without explanation as investors may be disregarding a distinct opportunity or a costly mistake.
See our latest analysis for HSC Resources Group
What Does HSC Resources Group's Recent Performance Look Like?
With revenue growth that's exceedingly strong of late, HSC Resources Group has been doing very well. The P/S is probably moderate because investors think this strong revenue growth might not be enough to outperform the broader industry in the near future. If you like the company, you'd be hoping this isn't the case so that you could potentially pick up some stock while it's not quite in favour.
We don't have analyst forecasts, but you can see how recent trends are setting up the company for the future by checking out our free report on HSC Resources Group's earnings, revenue and cash flow.Do Revenue Forecasts Match The P/S Ratio?
The only time you'd be comfortable seeing a P/S like HSC Resources Group's is when the company's growth is tracking the industry closely.
If we review the last year of revenue growth, the company posted a terrific increase of 68%. The strong recent performance means it was also able to grow revenue by 106% in total over the last three years. So we can start by confirming that the company has done a great job of growing revenue over that time.
When compared to the industry's one-year growth forecast of 8.7%, the most recent medium-term revenue trajectory is noticeably more alluring
In light of this, it's curious that HSC Resources Group's P/S sits in line with the majority of other companies. It may be that most investors are not convinced the company can maintain its recent growth rates.
The Key Takeaway
Following HSC Resources Group's share price tumble, its P/S is just clinging on to the industry median P/S. Typically, we'd caution against reading too much into price-to-sales ratios when settling on investment decisions, though it can reveal plenty about what other market participants think about the company.
We didn't quite envision HSC Resources Group's P/S sitting in line with the wider industry, considering the revenue growth over the last three-year is higher than the current industry outlook. When we see strong revenue with faster-than-industry growth, we can only assume potential risks are what might be placing pressure on the P/S ratio. While recent revenue trends over the past medium-term suggest that the risk of a price decline is low, investors appear to see the likelihood of revenue fluctuations in the future.
Before you take the next step, you should know about the 5 warning signs for HSC Resources Group (4 are a bit concerning!) that we have uncovered.
If strong companies turning a profit tickle your fancy, then you'll want to check out this free list of interesting companies that trade on a low P/E (but have proven they can grow earnings).
Valuation is complex, but we're here to simplify it.
Discover if HSC Resources Group might be undervalued or overvalued with our detailed analysis, featuring fair value estimates, potential risks, dividends, insider trades, and its financial condition.
Access Free AnalysisHave feedback on this article? Concerned about the content? Get in touch with us directly. Alternatively, email editorial-team (at) simplywallst.com.
This article by Simply Wall St is general in nature. We provide commentary based on historical data and analyst forecasts only using an unbiased methodology and our articles are not intended to be financial advice. It does not constitute a recommendation to buy or sell any stock, and does not take account of your objectives, or your financial situation. We aim to bring you long-term focused analysis driven by fundamental data. Note that our analysis may not factor in the latest price-sensitive company announcements or qualitative material. Simply Wall St has no position in any stocks mentioned.
About SEHK:1850
HSC Resources Group
An investment holding company, operates as a fire service installation contractor in Hong Kong.
Moderate risk with adequate balance sheet.
Market Insights

Advertisement
Community Narratives
Finding The True Value Of A Logistics Powerhouse
Fair Value US$95.21|8.4% undervalued
NV
Community Contributor
Paradigm Biopharmaceuticals Will Lead Osteoarthritis Treatment with Zilosul's FDA Success
Fair Value AU$5.50|92.1% undervalued
AM
Community Contributor
Barrick Mining (ABX:CA): A Gold Hedge against a U.S. Shutdown
Fair Value CA$60.00|24.2% undervalued
GM
Community Contributor