
Advertisement
- Hong Kong
- /
- Professional Services
- /
- SEHK:1486
Our Take On The Returns On Capital At C Cheng Holdings (HKG:1486)
There are a few key trends to look for if we want to identify the next multi-bagger. Ideally, a business will show two trends; firstly a growing return on capital employed (ROCE) and secondly, an increasing amount of capital employed. Ultimately, this demonstrates that it's a business that is reinvesting profits at increasing rates of return. However, after investigating C Cheng Holdings (HKG:1486), we don't think it's current trends fit the mold of a multi-bagger.
What is Return On Capital Employed (ROCE)?
Just to clarify if you're unsure, ROCE is a metric for evaluating how much pre-tax income (in percentage terms) a company earns on the capital invested in its business. The formula for this calculation on C Cheng Holdings is:
Return on Capital Employed = Earnings Before Interest and Tax (EBIT) ÷ (Total Assets - Current Liabilities)
0.0044 = HK$2.3m ÷ (HK$800m - HK$272m) (Based on the trailing twelve months to June 2020).
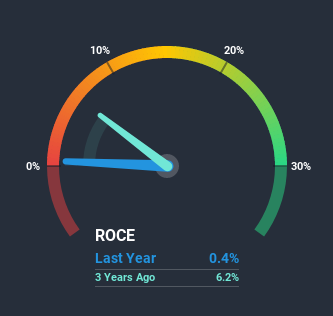
Therefore, C Cheng Holdings has an ROCE of 0.4%. In absolute terms, that's a low return and it also under-performs the Professional Services industry average of 14%.
See our latest analysis for C Cheng Holdings
While the past is not representative of the future, it can be helpful to know how a company has performed historically, which is why we have this chart above. If you want to delve into the historical earnings, revenue and cash flow of C Cheng Holdings, check out these free graphs here.
What Does the ROCE Trend For C Cheng Holdings Tell Us?
On the surface, the trend of ROCE at C Cheng Holdings doesn't inspire confidence. Over the last five years, returns on capital have decreased to 0.4% from 24% five years ago. On the other hand, the company has been employing more capital without a corresponding improvement in sales in the last year, which could suggest these investments are longer term plays. It may take some time before the company starts to see any change in earnings from these investments.
On a related note, C Cheng Holdings has decreased its current liabilities to 34% of total assets. So we could link some of this to the decrease in ROCE. Effectively this means their suppliers or short-term creditors are funding less of the business, which reduces some elements of risk. Since the business is basically funding more of its operations with it's own money, you could argue this has made the business less efficient at generating ROCE.In Conclusion...
Bringing it all together, while we're somewhat encouraged by C Cheng Holdings' reinvestment in its own business, we're aware that returns are shrinking. Since the stock has declined 52% over the last five years, investors may not be too optimistic on this trend improving either. On the whole, we aren't too inspired by the underlying trends and we think there may be better chances of finding a multi-bagger elsewhere.
If you'd like to know more about C Cheng Holdings, we've spotted 2 warning signs, and 1 of them makes us a bit uncomfortable.
For those who like to invest in solid companies, check out this free list of companies with solid balance sheets and high returns on equity.
If you’re looking to trade C Cheng Holdings, open an account with the lowest-cost* platform trusted by professionals, Interactive Brokers. Their clients from over 200 countries and territories trade stocks, options, futures, forex, bonds and funds worldwide from a single integrated account. Promoted
New: AI Stock Screener & Alerts
Our new AI Stock Screener scans the market every day to uncover opportunities.
• Dividend Powerhouses (3%+ Yield)
• Undervalued Small Caps with Insider Buying
• High growth Tech and AI Companies
Or build your own from over 50 metrics.
This article by Simply Wall St is general in nature. It does not constitute a recommendation to buy or sell any stock, and does not take account of your objectives, or your financial situation. We aim to bring you long-term focused analysis driven by fundamental data. Note that our analysis may not factor in the latest price-sensitive company announcements or qualitative material. Simply Wall St has no position in any stocks mentioned.
*Interactive Brokers Rated Lowest Cost Broker by StockBrokers.com Annual Online Review 2020
Have feedback on this article? Concerned about the content? Get in touch with us directly. Alternatively, email editorial-team@simplywallst.com.
About SEHK:1486
C Cheng Holdings
An investment holding company, provides architectural services in Mainland China, Hong Kong, the Middle East and North Africa, Macau, and internationally.
Excellent balance sheet and good value.
Market Insights

Advertisement
Community Narratives
The company that turned a verb into a global necessity and basically runs the modern internet, digital ads, smartphones, maps, and AI.
Fair Value US$300.00|7.5% undervalued
OS
Community Contributor
Flowers Foods Pays A Fair Price For Health
Fair Value US$16.12|25.4% undervalued
NV
Community Contributor
TMX Group will thrive with 33.3% profit margin and enduring market moat
Fair Value CA$49.90|3.6% overvalued
LI
Community Contributor
The "Molecular Pencil": Why Beam's Technology is Built to Win
Fair Value US$65.01|65.0% undervalued
DA
Community Contributor