
Advertisement
- Hong Kong
- /
- Trade Distributors
- /
- SEHK:8152
Does M&L Holdings Group (HKG:8152) Have A Healthy Balance Sheet?
Legendary fund manager Li Lu (who Charlie Munger backed) once said, 'The biggest investment risk is not the volatility of prices, but whether you will suffer a permanent loss of capital.' So it might be obvious that you need to consider debt, when you think about how risky any given stock is, because too much debt can sink a company. As with many other companies M&L Holdings Group Limited (HKG:8152) makes use of debt. But the more important question is: how much risk is that debt creating?
Why Does Debt Bring Risk?
Generally speaking, debt only becomes a real problem when a company can't easily pay it off, either by raising capital or with its own cash flow. Ultimately, if the company can't fulfill its legal obligations to repay debt, shareholders could walk away with nothing. However, a more usual (but still expensive) situation is where a company must dilute shareholders at a cheap share price simply to get debt under control. By replacing dilution, though, debt can be an extremely good tool for businesses that need capital to invest in growth at high rates of return. The first thing to do when considering how much debt a business uses is to look at its cash and debt together.
Check out our latest analysis for M&L Holdings Group
What Is M&L Holdings Group's Net Debt?
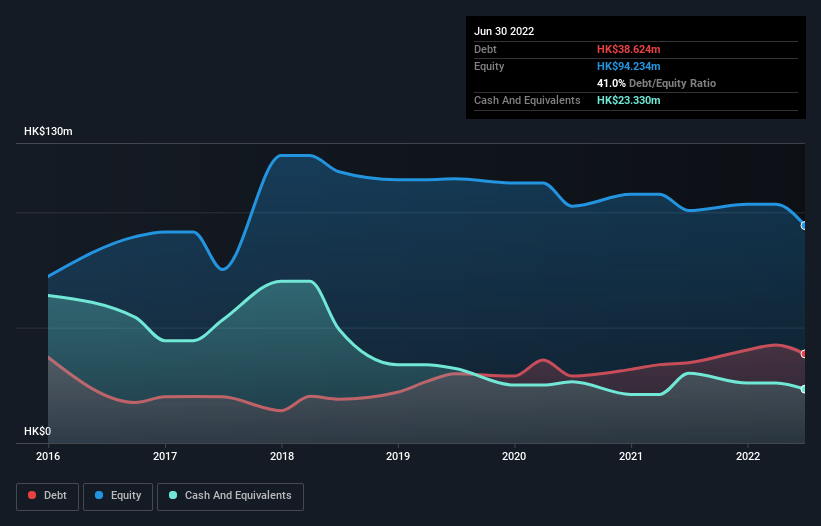
As you can see below, at the end of June 2022, M&L Holdings Group had HK$38.6m of debt, up from HK$34.8m a year ago. Click the image for more detail. On the flip side, it has HK$23.3m in cash leading to net debt of about HK$15.3m.
How Strong Is M&L Holdings Group's Balance Sheet?
We can see from the most recent balance sheet that M&L Holdings Group had liabilities of HK$72.0m falling due within a year, and liabilities of HK$9.27m due beyond that. On the other hand, it had cash of HK$23.3m and HK$76.8m worth of receivables due within a year. So it actually has HK$18.9m more liquid assets than total liabilities.
This surplus liquidity suggests that M&L Holdings Group's balance sheet could take a hit just as well as Homer Simpson's head can take a punch. Having regard to this fact, we think its balance sheet is as strong as an ox. There's no doubt that we learn most about debt from the balance sheet. But you can't view debt in total isolation; since M&L Holdings Group will need earnings to service that debt. So when considering debt, it's definitely worth looking at the earnings trend. Click here for an interactive snapshot.
In the last year M&L Holdings Group wasn't profitable at an EBIT level, but managed to grow its revenue by 2.7%, to HK$78m. That rate of growth is a bit slow for our taste, but it takes all types to make a world.
Caveat Emptor
Over the last twelve months M&L Holdings Group produced an earnings before interest and tax (EBIT) loss. Indeed, it lost a very considerable HK$7.1m at the EBIT level. On a more positive note, the company does have liquid assets, so it has a bit of time to improve its operations before the debt becomes an acute problem. Still, we'd be more encouraged to study the business in depth if it already had some free cash flow. This one is a bit too risky for our liking. There's no doubt that we learn most about debt from the balance sheet. But ultimately, every company can contain risks that exist outside of the balance sheet. Case in point: We've spotted 3 warning signs for M&L Holdings Group you should be aware of, and 2 of them can't be ignored.
When all is said and done, sometimes its easier to focus on companies that don't even need debt. Readers can access a list of growth stocks with zero net debt 100% free, right now.
New: Manage All Your Stock Portfolios in One Place
We've created the ultimate portfolio companion for stock investors, and it's free.
• Connect an unlimited number of Portfolios and see your total in one currency
• Be alerted to new Warning Signs or Risks via email or mobile
• Track the Fair Value of your stocks
Have feedback on this article? Concerned about the content? Get in touch with us directly. Alternatively, email editorial-team (at) simplywallst.com.
This article by Simply Wall St is general in nature. We provide commentary based on historical data and analyst forecasts only using an unbiased methodology and our articles are not intended to be financial advice. It does not constitute a recommendation to buy or sell any stock, and does not take account of your objectives, or your financial situation. We aim to bring you long-term focused analysis driven by fundamental data. Note that our analysis may not factor in the latest price-sensitive company announcements or qualitative material. Simply Wall St has no position in any stocks mentioned.
About SEHK:8152
M&L Holdings Group
An investment holding company, engages in the trading and leasing of construction machinery and spare parts in the People's Republic of China, Hong Kong, Vietnam, other Asia Pacific countries, the United States, Australia, and internationally.
Flawless balance sheet with very low risk.
Market Insights

Advertisement
Community Narratives
MicroVision will explode future revenue by 380.37% with a vision towards success
Fair Value US$60|98.4% undervalued
TH
Community Contributor
The Indispensable Artery for a New North American Economy
Fair Value CA$132.87|0.7% overvalued
TI
Community Contributor
Recently Updated Narratives
BE


Bejgal on MINISO Group Holding ·
MINISO's fair value is projected at 26.69 with an anticipated PE ratio shift of 20x
Fair Value:US$28.1829.5% undervalued
46 followersusers have followed this narrative
3 commentsusers have commented on this narrative
0 likesusers have liked this narrative
BE

Bejgal on Fiverr International ·
Fiverr International will transform the freelance industry with AI-powered growth
Fair Value:US$36.8143.1% undervalued
79 followersusers have followed this narrative
7 commentsusers have commented on this narrative
0 likesusers have liked this narrative
CE

cementafriend on Constellation Energy ·
Constellation Energy Dividends and Growth
Fair Value:US$348.054.7% overvalued
2 followersusers have followed this narrative
0 commentsusers have commented on this narrative
0 likesusers have liked this narrative
Popular Narratives
TH

TheWallstreetKing on MicroVision ·
MicroVision will explode future revenue by 380.37% with a vision towards success
Fair Value:US$6098.4% undervalued
109 followersusers have followed this narrative
10 commentsusers have commented on this narrative
21 likesusers have liked this narrative
AN


AnalystConsensusTarget on NVIDIA ·
NVDA: Expanding AI Demand Will Drive Major Data Center Investments Through 2026
Fair Value:US$250.3929.3% undervalued
937 followersusers have followed this narrative
6 commentsusers have commented on this narrative
24 likesusers have liked this narrative
OS


oscargarcia on Alphabet ·
The company that turned a verb into a global necessity and basically runs the modern internet, digital ads, smartphones, maps, and AI.
Fair Value:US$3405.8% undervalued
145 followersusers have followed this narrative
6 commentsusers have commented on this narrative
18 likesusers have liked this narrative