
Advertisement

Legendary fund manager Li Lu (who Charlie Munger backed) once said, 'The biggest investment risk is not the volatility of prices, but whether you will suffer a permanent loss of capital.' It's only natural to consider a company's balance sheet when you examine how risky it is, since debt is often involved when a business collapses. We note that E. Bon Holdings Limited (HKG:599) does have debt on its balance sheet. But should shareholders be worried about its use of debt?
What Risk Does Debt Bring?
Generally speaking, debt only becomes a real problem when a company can't easily pay it off, either by raising capital or with its own cash flow. Part and parcel of capitalism is the process of 'creative destruction' where failed businesses are mercilessly liquidated by their bankers. However, a more frequent (but still costly) occurrence is where a company must issue shares at bargain-basement prices, permanently diluting shareholders, just to shore up its balance sheet. Of course, the upside of debt is that it often represents cheap capital, especially when it replaces dilution in a company with the ability to reinvest at high rates of return. The first thing to do when considering how much debt a business uses is to look at its cash and debt together.
Check out our latest analysis for E. Bon Holdings
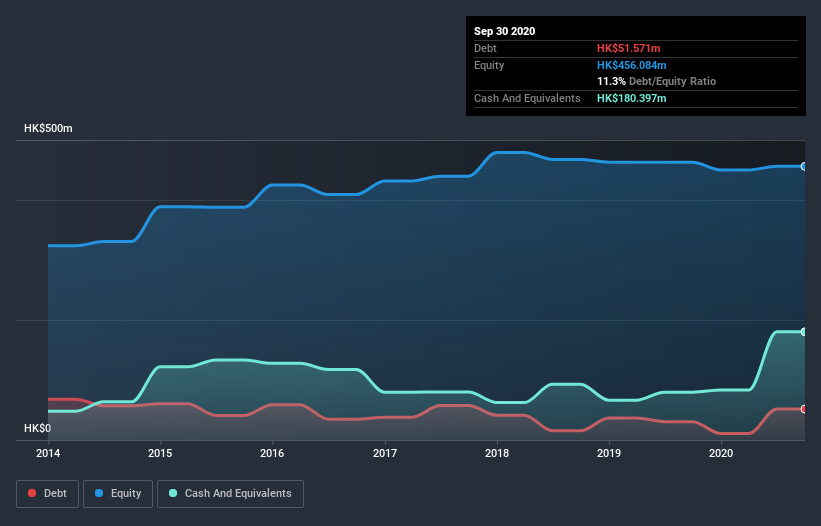
What Is E. Bon Holdings's Net Debt?
You can click the graphic below for the historical numbers, but it shows that as of September 2020 E. Bon Holdings had HK$51.6m of debt, an increase on HK$30.6m, over one year. However, its balance sheet shows it holds HK$180.4m in cash, so it actually has HK$128.8m net cash.
How Healthy Is E. Bon Holdings's Balance Sheet?
We can see from the most recent balance sheet that E. Bon Holdings had liabilities of HK$211.0m falling due within a year, and liabilities of HK$61.5m due beyond that. Offsetting these obligations, it had cash of HK$180.4m as well as receivables valued at HK$147.6m due within 12 months. So it actually has HK$55.6m more liquid assets than total liabilities.
This surplus liquidity suggests that E. Bon Holdings's balance sheet could take a hit just as well as Homer Simpson's head can take a punch. On this basis we think its balance sheet is strong like a sleek panther or even a proud lion. Simply put, the fact that E. Bon Holdings has more cash than debt is arguably a good indication that it can manage its debt safely.
Sadly, E. Bon Holdings's EBIT actually dropped 6.3% in the last year. If that earnings trend continues then its debt load will grow heavy like the heart of a polar bear watching its sole cub. There's no doubt that we learn most about debt from the balance sheet. But you can't view debt in total isolation; since E. Bon Holdings will need earnings to service that debt. So when considering debt, it's definitely worth looking at the earnings trend. Click here for an interactive snapshot.
Finally, a company can only pay off debt with cold hard cash, not accounting profits. E. Bon Holdings may have net cash on the balance sheet, but it is still interesting to look at how well the business converts its earnings before interest and tax (EBIT) to free cash flow, because that will influence both its need for, and its capacity to manage debt. Happily for any shareholders, E. Bon Holdings actually produced more free cash flow than EBIT over the last three years. That sort of strong cash conversion gets us as excited as the crowd when the beat drops at a Daft Punk concert.
Summing up
While it is always sensible to investigate a company's debt, in this case E. Bon Holdings has HK$128.8m in net cash and a decent-looking balance sheet. And it impressed us with free cash flow of HK$105m, being 250% of its EBIT. So is E. Bon Holdings's debt a risk? It doesn't seem so to us. There's no doubt that we learn most about debt from the balance sheet. However, not all investment risk resides within the balance sheet - far from it. Case in point: We've spotted 4 warning signs for E. Bon Holdings you should be aware of, and 1 of them is concerning.
At the end of the day, it's often better to focus on companies that are free from net debt. You can access our special list of such companies (all with a track record of profit growth). It's free.
If you decide to trade E. Bon Holdings, use the lowest-cost* platform that is rated #1 Overall by Barron’s, Interactive Brokers. Trade stocks, options, futures, forex, bonds and funds on 135 markets, all from a single integrated account. Promoted
Valuation is complex, but we're here to simplify it.
Discover if E. Bon Holdings might be undervalued or overvalued with our detailed analysis, featuring fair value estimates, potential risks, dividends, insider trades, and its financial condition.
Access Free AnalysisThis article by Simply Wall St is general in nature. It does not constitute a recommendation to buy or sell any stock, and does not take account of your objectives, or your financial situation. We aim to bring you long-term focused analysis driven by fundamental data. Note that our analysis may not factor in the latest price-sensitive company announcements or qualitative material. Simply Wall St has no position in any stocks mentioned.
*Interactive Brokers Rated Lowest Cost Broker by StockBrokers.com Annual Online Review 2020
Have feedback on this article? Concerned about the content? Get in touch with us directly. Alternatively, email editorial-team@simplywallst.com.
About SEHK:599
E. Bon Holdings
An investment holding company, engages in the importing, wholesale, retail and installation of architectural builders’ hardware, bathroom, kitchen collections, and furniture in the Hong Kong and the People’s Republic of China.
Adequate balance sheet and fair value.
Market Insights


Advertisement
Community Narratives
A case for TSXV:USA to reach USD $5.00 - $9.00 (CAD $7.30–$12.29) by 2029.
Fair Value CA$12.29|90.8% undervalued
AG
Community Contributor
DLocal's Future Growth Fueled by 35% Revenue and Profit Margin Boosts
Fair Value US$195.39|94.2% undervalued
WY
Community Contributor
Historically Cheap, but the Margin of Safety Is Still Thin
Fair Value SEK 232.58|12.7% undervalued
MA
Community Contributor