L.K. Technology Holdings' (HKG:558) 42% CAGR outpaced the company's earnings growth over the same five-year period


It hasn't been the best quarter for L.K. Technology Holdings Limited (HKG:558) shareholders, since the share price has fallen 21% in that time. But that doesn't undermine the fantastic longer term performance (measured over five years). In that time, the share price has soared some 428% higher! Arguably, the recent fall is to be expected after such a strong rise. The most important thing for savvy investors to consider is whether the underlying business can justify the share price gain. While the long term returns are impressive, we do have some sympathy for those who bought more recently, given the 64% drop, in the last year.
On the back of a solid 7-day performance, let's check what role the company's fundamentals have played in driving long term shareholder returns.
See our latest analysis for L.K. Technology Holdings
While markets are a powerful pricing mechanism, share prices reflect investor sentiment, not just underlying business performance. By comparing earnings per share (EPS) and share price changes over time, we can get a feel for how investor attitudes to a company have morphed over time.
Over half a decade, L.K. Technology Holdings managed to grow its earnings per share at 20% a year. This EPS growth is slower than the share price growth of 40% per year, over the same period. So it's fair to assume the market has a higher opinion of the business than it did five years ago. That's not necessarily surprising considering the five-year track record of earnings growth.
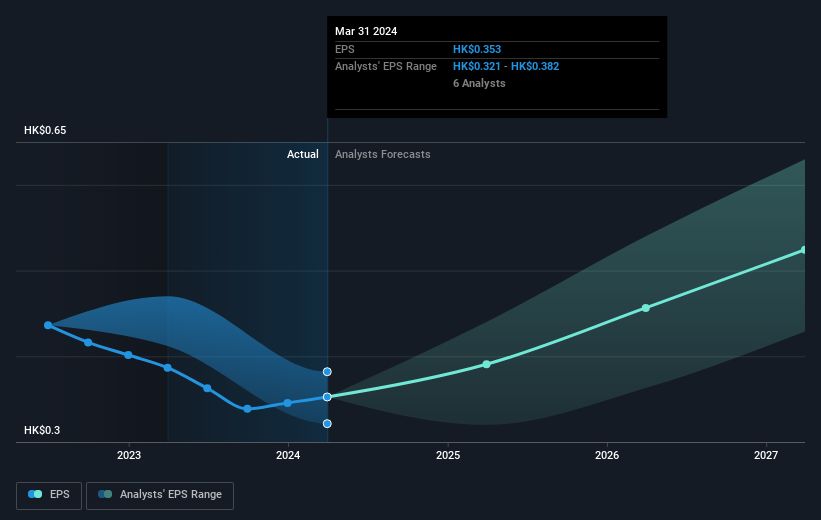
You can see below how EPS has changed over time (discover the exact values by clicking on the image).
Dive deeper into L.K. Technology Holdings' key metrics by checking this interactive graph of L.K. Technology Holdings's earnings, revenue and cash flow.
What About Dividends?
It is important to consider the total shareholder return, as well as the share price return, for any given stock. The TSR is a return calculation that accounts for the value of cash dividends (assuming that any dividend received was reinvested) and the calculated value of any discounted capital raisings and spin-offs. Arguably, the TSR gives a more comprehensive picture of the return generated by a stock. As it happens, L.K. Technology Holdings' TSR for the last 5 years was 470%, which exceeds the share price return mentioned earlier. This is largely a result of its dividend payments!
A Different Perspective
While the broader market gained around 6.3% in the last year, L.K. Technology Holdings shareholders lost 63% (even including dividends). Even the share prices of good stocks drop sometimes, but we want to see improvements in the fundamental metrics of a business, before getting too interested. Longer term investors wouldn't be so upset, since they would have made 42%, each year, over five years. It could be that the recent sell-off is an opportunity, so it may be worth checking the fundamental data for signs of a long term growth trend. I find it very interesting to look at share price over the long term as a proxy for business performance. But to truly gain insight, we need to consider other information, too. Consider for instance, the ever-present spectre of investment risk. We've identified 2 warning signs with L.K. Technology Holdings (at least 1 which is a bit concerning) , and understanding them should be part of your investment process.
For those who like to find winning investments this free list of undervalued companies with recent insider purchasing, could be just the ticket.
Please note, the market returns quoted in this article reflect the market weighted average returns of stocks that currently trade on Hong Kong exchanges.
New: AI Stock Screener & Alerts
Our new AI Stock Screener scans the market every day to uncover opportunities.
• Dividend Powerhouses (3%+ Yield)
• Undervalued Small Caps with Insider Buying
• High growth Tech and AI Companies
Or build your own from over 50 metrics.
Have feedback on this article? Concerned about the content? Get in touch with us directly. Alternatively, email editorial-team (at) simplywallst.com.
This article by Simply Wall St is general in nature. We provide commentary based on historical data and analyst forecasts only using an unbiased methodology and our articles are not intended to be financial advice. It does not constitute a recommendation to buy or sell any stock, and does not take account of your objectives, or your financial situation. We aim to bring you long-term focused analysis driven by fundamental data. Note that our analysis may not factor in the latest price-sensitive company announcements or qualitative material. Simply Wall St has no position in any stocks mentioned.
About SEHK:558
L.K. Technology Holdings
An investment holding company, engages in the design, manufacture, and sale of hot and cold chamber die-casting machines in Mainland China, Hong Kong, Europe, Central America and South America, North America, and internationally.
Excellent balance sheet with moderate growth potential.

