
Advertisement
RENHENG Enterprise Holdings (HKG:3628) Could Be Struggling To Allocate Capital
If you're looking at a mature business that's past the growth phase, what are some of the underlying trends that pop up? Businesses in decline often have two underlying trends, firstly, a declining return on capital employed (ROCE) and a declining base of capital employed. This indicates the company is producing less profit from its investments and its total assets are decreasing. In light of that, from a first glance at RENHENG Enterprise Holdings (HKG:3628), we've spotted some signs that it could be struggling, so let's investigate.
What Is Return On Capital Employed (ROCE)?
If you haven't worked with ROCE before, it measures the 'return' (pre-tax profit) a company generates from capital employed in its business. The formula for this calculation on RENHENG Enterprise Holdings is:
Return on Capital Employed = Earnings Before Interest and Tax (EBIT) ÷ (Total Assets - Current Liabilities)
0.0069 = HK$767k ÷ (HK$225m - HK$114m) (Based on the trailing twelve months to June 2023).
So, RENHENG Enterprise Holdings has an ROCE of 0.7%. Ultimately, that's a low return and it under-performs the Machinery industry average of 7.4%.
View our latest analysis for RENHENG Enterprise Holdings
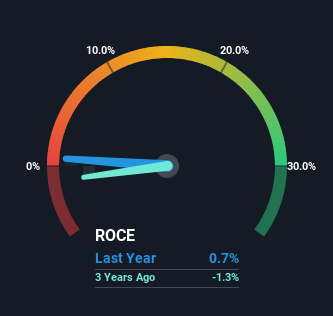
Historical performance is a great place to start when researching a stock so above you can see the gauge for RENHENG Enterprise Holdings' ROCE against it's prior returns. If you'd like to look at how RENHENG Enterprise Holdings has performed in the past in other metrics, you can view this free graph of RENHENG Enterprise Holdings' past earnings, revenue and cash flow.
So How Is RENHENG Enterprise Holdings' ROCE Trending?
We are a bit worried about the trend of returns on capital at RENHENG Enterprise Holdings. About five years ago, returns on capital were 1.2%, however they're now substantially lower than that as we saw above. And on the capital employed front, the business is utilizing roughly the same amount of capital as it was back then. Since returns are falling and the business has the same amount of assets employed, this can suggest it's a mature business that hasn't had much growth in the last five years. So because these trends aren't typically conducive to creating a multi-bagger, we wouldn't hold our breath on RENHENG Enterprise Holdings becoming one if things continue as they have.
On a side note, RENHENG Enterprise Holdings' current liabilities have increased over the last five years to 51% of total assets, effectively distorting the ROCE to some degree. Without this increase, it's likely that ROCE would be even lower than 0.7%. What this means is that in reality, a rather large portion of the business is being funded by the likes of the company's suppliers or short-term creditors, which can bring some risks of its own.
What We Can Learn From RENHENG Enterprise Holdings' ROCE
All in all, the lower returns from the same amount of capital employed aren't exactly signs of a compounding machine. It should come as no surprise then that the stock has fallen 54% over the last five years, so it looks like investors are recognizing these changes. With underlying trends that aren't great in these areas, we'd consider looking elsewhere.
On a final note, we found 2 warning signs for RENHENG Enterprise Holdings (1 shouldn't be ignored) you should be aware of.
If you want to search for solid companies with great earnings, check out this free list of companies with good balance sheets and impressive returns on equity.
New: AI Stock Screener & Alerts
Our new AI Stock Screener scans the market every day to uncover opportunities.
• Dividend Powerhouses (3%+ Yield)
• Undervalued Small Caps with Insider Buying
• High growth Tech and AI Companies
Or build your own from over 50 metrics.
Have feedback on this article? Concerned about the content? Get in touch with us directly. Alternatively, email editorial-team (at) simplywallst.com.
This article by Simply Wall St is general in nature. We provide commentary based on historical data and analyst forecasts only using an unbiased methodology and our articles are not intended to be financial advice. It does not constitute a recommendation to buy or sell any stock, and does not take account of your objectives, or your financial situation. We aim to bring you long-term focused analysis driven by fundamental data. Note that our analysis may not factor in the latest price-sensitive company announcements or qualitative material. Simply Wall St has no position in any stocks mentioned.
About SEHK:3628
RENHENG Enterprise Holdings
An investment holding company, engages in the manufacture and sale of tobacco machinery products in the People’s Republic of China.
Flawless balance sheet and slightly overvalued.
Market Insights

Advertisement
Community Narratives
MicroVision will explode future revenue by 380.37% with a vision towards success
Fair Value US$60.00|98.4% undervalued
TH
Community Contributor
The Indispensable Artery for a New North American Economy
Fair Value CA$132.87|1.3% undervalued
TI
Community Contributor