
Advertisement
- Hong Kong
- /
- Construction
- /
- SEHK:2386
SINOPEC Engineering (Group) (HKG:2386) Has Some Difficulty Using Its Capital Effectively
What underlying fundamental trends can indicate that a company might be in decline? More often than not, we'll see a declining return on capital employed (ROCE) and a declining amount of capital employed. This combination can tell you that not only is the company investing less, it's earning less on what it does invest. Having said that, after a brief look, SINOPEC Engineering (Group) (HKG:2386) we aren't filled with optimism, but let's investigate further.
Return On Capital Employed (ROCE): What Is It?
For those who don't know, ROCE is a measure of a company's yearly pre-tax profit (its return), relative to the capital employed in the business. The formula for this calculation on SINOPEC Engineering (Group) is:
Return on Capital Employed = Earnings Before Interest and Tax (EBIT) ÷ (Total Assets - Current Liabilities)
0.038 = CN¥1.3b ÷ (CN¥77b - CN¥45b) (Based on the trailing twelve months to June 2023).
Therefore, SINOPEC Engineering (Group) has an ROCE of 3.8%. In absolute terms, that's a low return and it also under-performs the Construction industry average of 6.5%.
Check out our latest analysis for SINOPEC Engineering (Group)
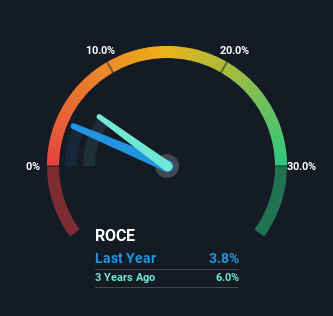
Above you can see how the current ROCE for SINOPEC Engineering (Group) compares to its prior returns on capital, but there's only so much you can tell from the past. If you'd like, you can check out the forecasts from the analysts covering SINOPEC Engineering (Group) here for free.
What The Trend Of ROCE Can Tell Us
In terms of SINOPEC Engineering (Group)'s historical ROCE movements, the trend doesn't inspire confidence. Unfortunately the returns on capital have diminished from the 5.2% that they were earning five years ago. And on the capital employed front, the business is utilizing roughly the same amount of capital as it was back then. Since returns are falling and the business has the same amount of assets employed, this can suggest it's a mature business that hasn't had much growth in the last five years. So because these trends aren't typically conducive to creating a multi-bagger, we wouldn't hold our breath on SINOPEC Engineering (Group) becoming one if things continue as they have.
On a separate but related note, it's important to know that SINOPEC Engineering (Group) has a current liabilities to total assets ratio of 58%, which we'd consider pretty high. This effectively means that suppliers (or short-term creditors) are funding a large portion of the business, so just be aware that this can introduce some elements of risk. While it's not necessarily a bad thing, it can be beneficial if this ratio is lower.
The Bottom Line On SINOPEC Engineering (Group)'s ROCE
In the end, the trend of lower returns on the same amount of capital isn't typically an indication that we're looking at a growth stock. Long term shareholders who've owned the stock over the last five years have experienced a 20% depreciation in their investment, so it appears the market might not like these trends either. That being the case, unless the underlying trends revert to a more positive trajectory, we'd consider looking elsewhere.
SINOPEC Engineering (Group) does have some risks though, and we've spotted 1 warning sign for SINOPEC Engineering (Group) that you might be interested in.
While SINOPEC Engineering (Group) isn't earning the highest return, check out this free list of companies that are earning high returns on equity with solid balance sheets.
New: Manage All Your Stock Portfolios in One Place
We've created the ultimate portfolio companion for stock investors, and it's free.
• Connect an unlimited number of Portfolios and see your total in one currency
• Be alerted to new Warning Signs or Risks via email or mobile
• Track the Fair Value of your stocks
Have feedback on this article? Concerned about the content? Get in touch with us directly. Alternatively, email editorial-team (at) simplywallst.com.
This article by Simply Wall St is general in nature. We provide commentary based on historical data and analyst forecasts only using an unbiased methodology and our articles are not intended to be financial advice. It does not constitute a recommendation to buy or sell any stock, and does not take account of your objectives, or your financial situation. We aim to bring you long-term focused analysis driven by fundamental data. Note that our analysis may not factor in the latest price-sensitive company announcements or qualitative material. Simply Wall St has no position in any stocks mentioned.
About SEHK:2386
SINOPEC Engineering (Group)
Provides engineering, procurement, and construction (EPC) contracting services in the People’s Republic of China, Saudi Arabia, Kuwait, and internationally.
Excellent balance sheet with proven track record and pays a dividend.
Market Insights

Advertisement
Community Narratives
MINISO's fair value is projected at 26.69 with an anticipated PE ratio shift of 20x
Fair Value US$24.03|11.4% undervalued
BE
Community Contributor
Procter & Gamble: A Dividend Giant Facing Slowing Growth
Fair Value US$119.81|23.5% overvalued
AN
Community Contributor
Eli Lilly's Future Growth Driven by Tirzepatide and Favorable Market Conditions
Fair Value US$1.19k|14.0% undervalued
EA
Community Contributor