
Advertisement
Some say volatility, rather than debt, is the best way to think about risk as an investor, but Warren Buffett famously said that 'Volatility is far from synonymous with risk.' So it seems the smart money knows that debt - which is usually involved in bankruptcies - is a very important factor, when you assess how risky a company is. Importantly, Wan Kei Group Holdings Limited (HKG:1718) does carry debt. But the more important question is: how much risk is that debt creating?
When Is Debt A Problem?
Generally speaking, debt only becomes a real problem when a company can't easily pay it off, either by raising capital or with its own cash flow. In the worst case scenario, a company can go bankrupt if it cannot pay its creditors. However, a more usual (but still expensive) situation is where a company must dilute shareholders at a cheap share price simply to get debt under control. Of course, the upside of debt is that it often represents cheap capital, especially when it replaces dilution in a company with the ability to reinvest at high rates of return. The first step when considering a company's debt levels is to consider its cash and debt together.
Check out our latest analysis for Wan Kei Group Holdings
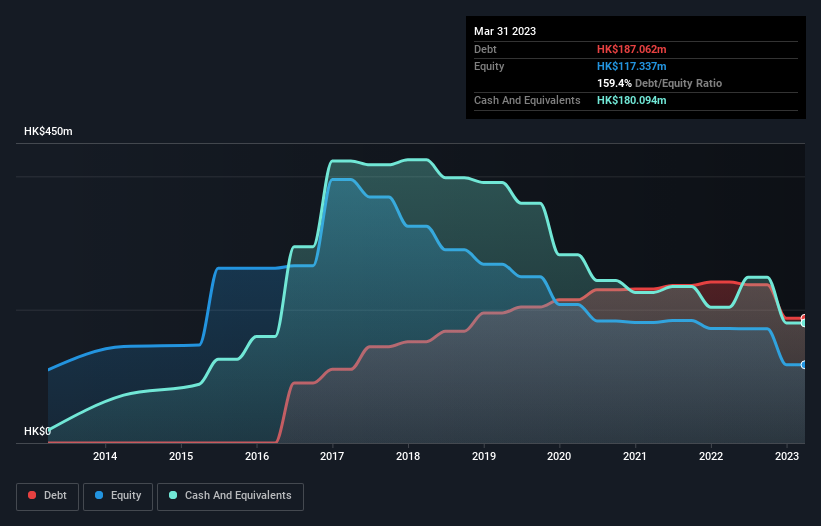
What Is Wan Kei Group Holdings's Net Debt?
You can click the graphic below for the historical numbers, but it shows that Wan Kei Group Holdings had HK$187.1m of debt in March 2023, down from HK$241.6m, one year before. However, it does have HK$180.1m in cash offsetting this, leading to net debt of about HK$6.97m.
How Healthy Is Wan Kei Group Holdings' Balance Sheet?
According to the last reported balance sheet, Wan Kei Group Holdings had liabilities of HK$234.2m due within 12 months, and liabilities of HK$2.53m due beyond 12 months. Offsetting this, it had HK$180.1m in cash and HK$155.7m in receivables that were due within 12 months. So it can boast HK$99.1m more liquid assets than total liabilities.
This excess liquidity is a great indication that Wan Kei Group Holdings' balance sheet is almost as strong as Fort Knox. Having regard to this fact, we think its balance sheet is as strong as an ox. When analysing debt levels, the balance sheet is the obvious place to start. But it is Wan Kei Group Holdings's earnings that will influence how the balance sheet holds up in the future. So if you're keen to discover more about its earnings, it might be worth checking out this graph of its long term earnings trend.
In the last year Wan Kei Group Holdings wasn't profitable at an EBIT level, but managed to grow its revenue by 20%, to HK$315m. That rate of growth is a bit slow for our taste, but it takes all types to make a world.
Caveat Emptor
Over the last twelve months Wan Kei Group Holdings produced an earnings before interest and tax (EBIT) loss. Its EBIT loss was a whopping HK$28m. That said, we're impressed with the strong balance sheet liquidity. That will give the company some time and space to grow and develop its business as need be. While the stock is probably a bit risky, there may be an opportunity if the business itself improves, allowing the company to stage a recovery. There's no doubt that we learn most about debt from the balance sheet. However, not all investment risk resides within the balance sheet - far from it. We've identified 2 warning signs with Wan Kei Group Holdings , and understanding them should be part of your investment process.
If you're interested in investing in businesses that can grow profits without the burden of debt, then check out this free list of growing businesses that have net cash on the balance sheet.
Valuation is complex, but we're here to simplify it.
Discover if Wan Kei Group Holdings might be undervalued or overvalued with our detailed analysis, featuring fair value estimates, potential risks, dividends, insider trades, and its financial condition.
Access Free AnalysisHave feedback on this article? Concerned about the content? Get in touch with us directly. Alternatively, email editorial-team (at) simplywallst.com.
This article by Simply Wall St is general in nature. We provide commentary based on historical data and analyst forecasts only using an unbiased methodology and our articles are not intended to be financial advice. It does not constitute a recommendation to buy or sell any stock, and does not take account of your objectives, or your financial situation. We aim to bring you long-term focused analysis driven by fundamental data. Note that our analysis may not factor in the latest price-sensitive company announcements or qualitative material. Simply Wall St has no position in any stocks mentioned.
About SEHK:1718
Wan Kei Group Holdings
An investment holding company, provides foundation construction and ground investigation field works to public and private sectors in Hong Kong and Mainland China.
Adequate balance sheet with slight risk.
Similar Companies
Market Insights

Advertisement
Community Narratives
MINISO's fair value is projected at 26.69 with an anticipated PE ratio shift of 20x
Fair Value US$24.03|11.0% undervalued
BE
Community Contributor
Procter & Gamble: A Dividend Giant Facing Slowing Growth
Fair Value US$119.81|23.3% overvalued
AN
Community Contributor
Eli Lilly's Future Growth Driven by Tirzepatide and Favorable Market Conditions
Fair Value US$1.19k|13.8% undervalued
EA
Community Contributor