
Advertisement
- Hong Kong
- /
- Trade Distributors
- /
- SEHK:1581
There's No Escaping Progressive Path Group Holdings Limited's (HKG:1581) Muted Revenues Despite A 30% Share Price Rise
The Progressive Path Group Holdings Limited (HKG:1581) share price has done very well over the last month, posting an excellent gain of 30%. Unfortunately, the gains of the last month did little to right the losses of the last year with the stock still down 12% over that time.
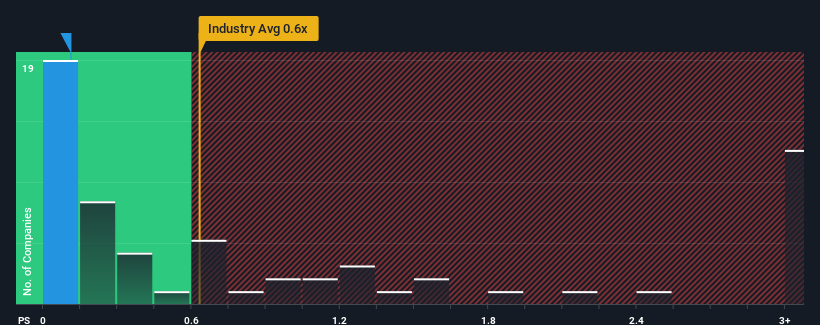
Even after such a large jump in price, when close to half the companies operating in Hong Kong's Trade Distributors industry have price-to-sales ratios (or "P/S") above 0.6x, you may still consider Progressive Path Group Holdings as an enticing stock to check out with its 0.1x P/S ratio. Although, it's not wise to just take the P/S at face value as there may be an explanation why it's limited.
See our latest analysis for Progressive Path Group Holdings
What Does Progressive Path Group Holdings' Recent Performance Look Like?
The revenue growth achieved at Progressive Path Group Holdings over the last year would be more than acceptable for most companies. One possibility is that the P/S is low because investors think this respectable revenue growth might actually underperform the broader industry in the near future. Those who are bullish on Progressive Path Group Holdings will be hoping that this isn't the case, so that they can pick up the stock at a lower valuation.
Although there are no analyst estimates available for Progressive Path Group Holdings, take a look at this free data-rich visualisation to see how the company stacks up on earnings, revenue and cash flow.How Is Progressive Path Group Holdings' Revenue Growth Trending?
The only time you'd be truly comfortable seeing a P/S as low as Progressive Path Group Holdings' is when the company's growth is on track to lag the industry.
Retrospectively, the last year delivered a decent 12% gain to the company's revenues. Pleasingly, revenue has also lifted 43% in aggregate from three years ago, partly thanks to the last 12 months of growth. Therefore, it's fair to say the revenue growth recently has been superb for the company.
This is in contrast to the rest of the industry, which is expected to grow by 24% over the next year, materially higher than the company's recent medium-term annualised growth rates.
With this in consideration, it's easy to understand why Progressive Path Group Holdings' P/S falls short of the mark set by its industry peers. It seems most investors are expecting to see the recent limited growth rates continue into the future and are only willing to pay a reduced amount for the stock.
What We Can Learn From Progressive Path Group Holdings' P/S?
Despite Progressive Path Group Holdings' share price climbing recently, its P/S still lags most other companies. Using the price-to-sales ratio alone to determine if you should sell your stock isn't sensible, however it can be a practical guide to the company's future prospects.
As we suspected, our examination of Progressive Path Group Holdings revealed its three-year revenue trends are contributing to its low P/S, given they look worse than current industry expectations. At this stage investors feel the potential for an improvement in revenue isn't great enough to justify a higher P/S ratio. Unless the recent medium-term conditions improve, they will continue to form a barrier for the share price around these levels.
You always need to take note of risks, for example - Progressive Path Group Holdings has 1 warning sign we think you should be aware of.
If companies with solid past earnings growth is up your alley, you may wish to see this free collection of other companies with strong earnings growth and low P/E ratios.
New: Manage All Your Stock Portfolios in One Place
We've created the ultimate portfolio companion for stock investors, and it's free.
• Connect an unlimited number of Portfolios and see your total in one currency
• Be alerted to new Warning Signs or Risks via email or mobile
• Track the Fair Value of your stocks
Have feedback on this article? Concerned about the content? Get in touch with us directly. Alternatively, email editorial-team (at) simplywallst.com.
This article by Simply Wall St is general in nature. We provide commentary based on historical data and analyst forecasts only using an unbiased methodology and our articles are not intended to be financial advice. It does not constitute a recommendation to buy or sell any stock, and does not take account of your objectives, or your financial situation. We aim to bring you long-term focused analysis driven by fundamental data. Note that our analysis may not factor in the latest price-sensitive company announcements or qualitative material. Simply Wall St has no position in any stocks mentioned.
About SEHK:1581
Progressive Path Group Holdings
An investment holding company, engages in the construction business in Hong Kong.
Solid track record with excellent balance sheet.
Market Insights

Advertisement
Community Narratives
Finding The True Value Of A Logistics Powerhouse
Fair Value US$95.21|8.4% undervalued
NV
Community Contributor
Paradigm Biopharmaceuticals Will Lead Osteoarthritis Treatment with Zilosul's FDA Success
Fair Value AU$5.50|92.1% undervalued
AM
Community Contributor
Barrick Mining (ABX:CA): A Gold Hedge against a U.S. Shutdown
Fair Value CA$60.00|24.2% undervalued
GM
Community Contributor