
Advertisement
- Hong Kong
- /
- Construction
- /
- SEHK:1429
Revenues Not Telling The Story For Skymission Group Holdings Limited (HKG:1429) After Shares Rise 43%
Despite an already strong run, Skymission Group Holdings Limited (HKG:1429) shares have been powering on, with a gain of 43% in the last thirty days. The annual gain comes to 158% following the latest surge, making investors sit up and take notice.
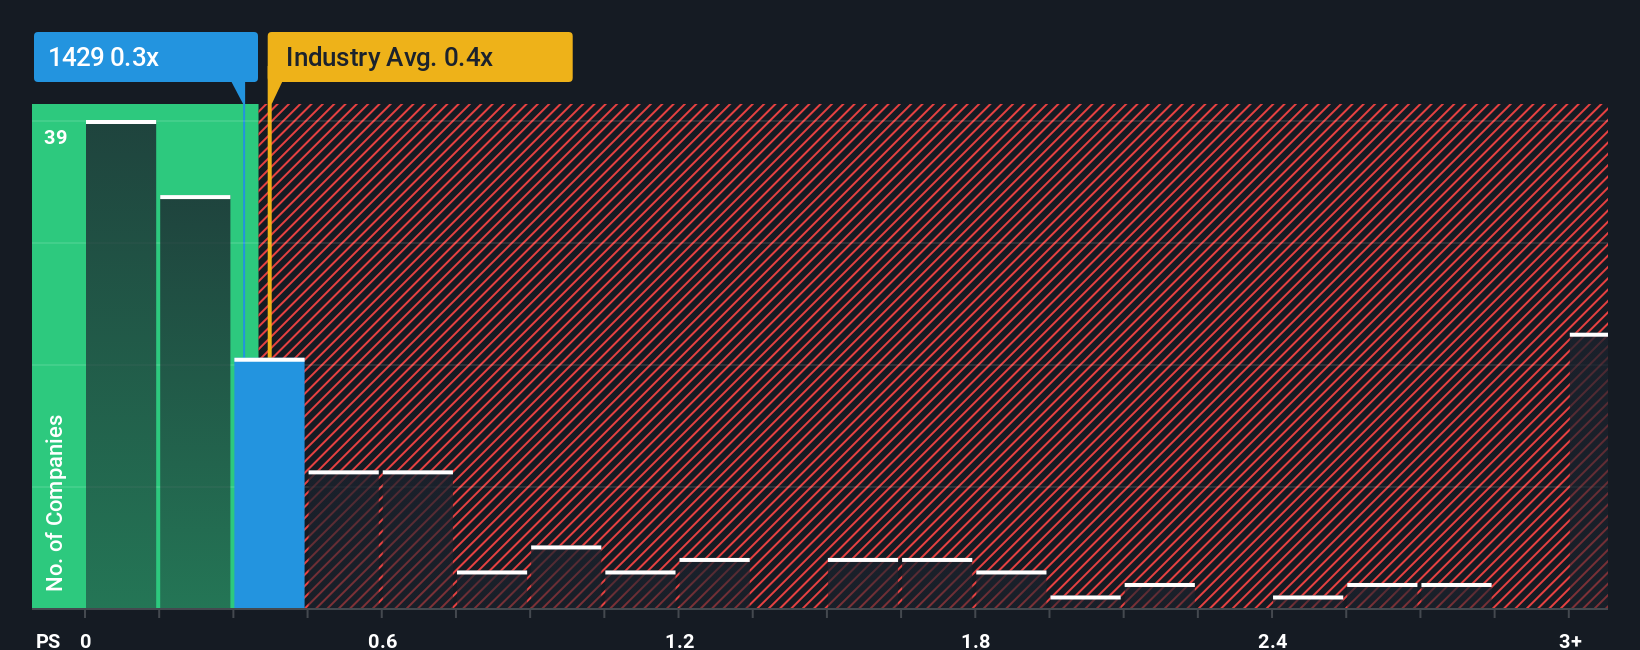
In spite of the firm bounce in price, you could still be forgiven for feeling indifferent about Skymission Group Holdings' P/S ratio of 0.3x, since the median price-to-sales (or "P/S") ratio for the Construction industry in Hong Kong is also close to 0.4x. However, investors might be overlooking a clear opportunity or potential setback if there is no rational basis for the P/S.
Check out our latest analysis for Skymission Group Holdings
How Has Skymission Group Holdings Performed Recently?
For instance, Skymission Group Holdings' receding revenue in recent times would have to be some food for thought. Perhaps investors believe the recent revenue performance is enough to keep in line with the industry, which is keeping the P/S from dropping off. If you like the company, you'd at least be hoping this is the case so that you could potentially pick up some stock while it's not quite in favour.
Want the full picture on earnings, revenue and cash flow for the company? Then our free report on Skymission Group Holdings will help you shine a light on its historical performance.Do Revenue Forecasts Match The P/S Ratio?
There's an inherent assumption that a company should be matching the industry for P/S ratios like Skymission Group Holdings' to be considered reasonable.
Taking a look back first, the company's revenue growth last year wasn't something to get excited about as it posted a disappointing decline of 34%. As a result, revenue from three years ago have also fallen 25% overall. Therefore, it's fair to say the revenue growth recently has been undesirable for the company.
Weighing that medium-term revenue trajectory against the broader industry's one-year forecast for expansion of 18% shows it's an unpleasant look.
With this in mind, we find it worrying that Skymission Group Holdings' P/S exceeds that of its industry peers. It seems most investors are ignoring the recent poor growth rate and are hoping for a turnaround in the company's business prospects. Only the boldest would assume these prices are sustainable as a continuation of recent revenue trends is likely to weigh on the share price eventually.
What Does Skymission Group Holdings' P/S Mean For Investors?
Its shares have lifted substantially and now Skymission Group Holdings' P/S is back within range of the industry median. Typically, we'd caution against reading too much into price-to-sales ratios when settling on investment decisions, though it can reveal plenty about what other market participants think about the company.
Our look at Skymission Group Holdings revealed its shrinking revenues over the medium-term haven't impacted the P/S as much as we anticipated, given the industry is set to grow. Even though it matches the industry, we're uncomfortable with the current P/S ratio, as this dismal revenue performance is unlikely to support a more positive sentiment for long. Unless the recent medium-term conditions improve markedly, investors will have a hard time accepting the share price as fair value.
Having said that, be aware Skymission Group Holdings is showing 3 warning signs in our investment analysis, and 2 of those are significant.
If you're unsure about the strength of Skymission Group Holdings' business, why not explore our interactive list of stocks with solid business fundamentals for some other companies you may have missed.
New: Manage All Your Stock Portfolios in One Place
We've created the ultimate portfolio companion for stock investors, and it's free.
• Connect an unlimited number of Portfolios and see your total in one currency
• Be alerted to new Warning Signs or Risks via email or mobile
• Track the Fair Value of your stocks
Have feedback on this article? Concerned about the content? Get in touch with us directly. Alternatively, email editorial-team (at) simplywallst.com.
This article by Simply Wall St is general in nature. We provide commentary based on historical data and analyst forecasts only using an unbiased methodology and our articles are not intended to be financial advice. It does not constitute a recommendation to buy or sell any stock, and does not take account of your objectives, or your financial situation. We aim to bring you long-term focused analysis driven by fundamental data. Note that our analysis may not factor in the latest price-sensitive company announcements or qualitative material. Simply Wall St has no position in any stocks mentioned.
About SEHK:1429
Mediocre balance sheet with low risk.
Market Insights

Advertisement
Community Narratives
The company that turned a verb into a global necessity and basically runs the modern internet, digital ads, smartphones, maps, and AI.
Fair Value US$300.00|6.2% undervalued
OS
Community Contributor
Flowers Foods Pays A Fair Price For Health
Fair Value US$16.12|25.1% undervalued
NV
Community Contributor
TMX Group will thrive with 33.3% profit margin and enduring market moat
Fair Value CA$49.90|0.04% overvalued
LI
Community Contributor