
Advertisement
- Hong Kong
- /
- Trade Distributors
- /
- SEHK:1231
Returns On Capital Signal Difficult Times Ahead For Newton Resources (HKG:1231)
What underlying fundamental trends can indicate that a company might be in decline? A business that's potentially in decline often shows two trends, a return on capital employed (ROCE) that's declining, and a base of capital employed that's also declining. This indicates the company is producing less profit from its investments and its total assets are decreasing. On that note, looking into Newton Resources (HKG:1231), we weren't too upbeat about how things were going.
We check all companies for important risks. See what we found for Newton Resources in our free report.Understanding Return On Capital Employed (ROCE)
For those that aren't sure what ROCE is, it measures the amount of pre-tax profits a company can generate from the capital employed in its business. The formula for this calculation on Newton Resources is:
Return on Capital Employed = Earnings Before Interest and Tax (EBIT) ÷ (Total Assets - Current Liabilities)
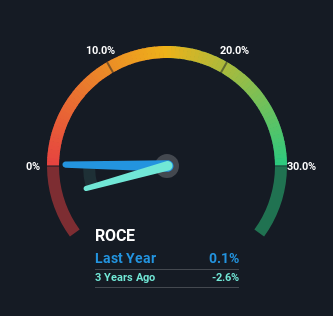
0.0014 = US$41k ÷ (US$71m - US$41m) (Based on the trailing twelve months to December 2024).
Therefore, Newton Resources has an ROCE of 0.1%. In absolute terms, that's a low return and it also under-performs the Trade Distributors industry average of 6.0%.
View our latest analysis for Newton Resources
While the past is not representative of the future, it can be helpful to know how a company has performed historically, which is why we have this chart above. If you want to delve into the historical earnings , check out these free graphs detailing revenue and cash flow performance of Newton Resources.
What Can We Tell From Newton Resources' ROCE Trend?
In terms of Newton Resources' historical ROCE trend, it isn't fantastic. To be more specific, today's ROCE was 2.3% five years ago but has since fallen to 0.1%. On top of that, the business is utilizing 25% less capital within its operations. The fact that both are shrinking is an indication that the business is going through some tough times. Typically businesses that exhibit these characteristics aren't the ones that tend to multiply over the long term, because statistically speaking, they've already gone through the growth phase of their life cycle.
On a related note, Newton Resources has decreased its current liabilities to 58% of total assets. So we could link some of this to the decrease in ROCE. Effectively this means their suppliers or short-term creditors are funding less of the business, which reduces some elements of risk. Some would claim this reduces the business' efficiency at generating ROCE since it is now funding more of the operations with its own money. Keep in mind 58% is still pretty high, so those risks are still somewhat prevalent.
What We Can Learn From Newton Resources' ROCE
In short, lower returns and decreasing amounts capital employed in the business doesn't fill us with confidence. Long term shareholders who've owned the stock over the last five years have experienced a 51% depreciation in their investment, so it appears the market might not like these trends either. Unless there is a shift to a more positive trajectory in these metrics, we would look elsewhere.
While Newton Resources doesn't shine too bright in this respect, it's still worth seeing if the company is trading at attractive prices. You can find that out with our FREE intrinsic value estimation for 1231 on our platform.
If you want to search for solid companies with great earnings, check out this free list of companies with good balance sheets and impressive returns on equity.
Valuation is complex, but we're here to simplify it.
Discover if Newton Resources might be undervalued or overvalued with our detailed analysis, featuring fair value estimates, potential risks, dividends, insider trades, and its financial condition.
Access Free AnalysisHave feedback on this article? Concerned about the content? Get in touch with us directly. Alternatively, email editorial-team (at) simplywallst.com.
This article by Simply Wall St is general in nature. We provide commentary based on historical data and analyst forecasts only using an unbiased methodology and our articles are not intended to be financial advice. It does not constitute a recommendation to buy or sell any stock, and does not take account of your objectives, or your financial situation. We aim to bring you long-term focused analysis driven by fundamental data. Note that our analysis may not factor in the latest price-sensitive company announcements or qualitative material. Simply Wall St has no position in any stocks mentioned.
About SEHK:1231
Newton Resources
An investment holding company, engages in identification and exploration of sourcing and supply of iron ores and other commodities in Mainland China and internationally.
Flawless balance sheet and fair value.
Similar Companies
Market Insights

Advertisement
Community Narratives
MINISO's fair value is projected at 26.69 with an anticipated PE ratio shift of 20x
Fair Value US$24.03|11.0% undervalued
BE
Community Contributor
Procter & Gamble: A Dividend Giant Facing Slowing Growth
Fair Value US$119.81|23.3% overvalued
AN
Community Contributor
Eli Lilly's Future Growth Driven by Tirzepatide and Favorable Market Conditions
Fair Value US$1.19k|13.8% undervalued
EA
Community Contributor