
Advertisement
- Hong Kong
- /
- Trade Distributors
- /
- SEHK:1001
Hong Kong Shanghai Alliance Holdings' (HKG:1001) Returns On Capital Are Heading Higher
What are the early trends we should look for to identify a stock that could multiply in value over the long term? Firstly, we'd want to identify a growing return on capital employed (ROCE) and then alongside that, an ever-increasing base of capital employed. Ultimately, this demonstrates that it's a business that is reinvesting profits at increasing rates of return. So when we looked at Hong Kong Shanghai Alliance Holdings (HKG:1001) and its trend of ROCE, we really liked what we saw.
Return On Capital Employed (ROCE): What Is It?
For those that aren't sure what ROCE is, it measures the amount of pre-tax profits a company can generate from the capital employed in its business. To calculate this metric for Hong Kong Shanghai Alliance Holdings, this is the formula:
Return on Capital Employed = Earnings Before Interest and Tax (EBIT) ÷ (Total Assets - Current Liabilities)
0.15 = HK$183m ÷ (HK$3.0b - HK$1.7b) (Based on the trailing twelve months to March 2023).
Therefore, Hong Kong Shanghai Alliance Holdings has an ROCE of 15%. On its own, that's a standard return, however it's much better than the 5.5% generated by the Trade Distributors industry.
View our latest analysis for Hong Kong Shanghai Alliance Holdings
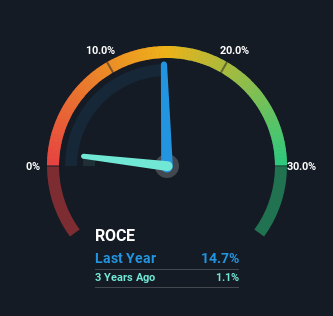
Historical performance is a great place to start when researching a stock so above you can see the gauge for Hong Kong Shanghai Alliance Holdings' ROCE against it's prior returns. If you're interested in investigating Hong Kong Shanghai Alliance Holdings' past further, check out this free graph of past earnings, revenue and cash flow.
So How Is Hong Kong Shanghai Alliance Holdings' ROCE Trending?
We're delighted to see that Hong Kong Shanghai Alliance Holdings is reaping rewards from its investments and has now broken into profitability. Historically the company was generating losses but as we can see from the latest figures referenced above, they're now earning 15% on their capital employed. In regards to capital employed, Hong Kong Shanghai Alliance Holdings is using 30% less capital than it was five years ago, which on the surface, can indicate that the business has become more efficient at generating these returns. Hong Kong Shanghai Alliance Holdings could be selling under-performing assets since the ROCE is improving.
For the record though, there was a noticeable increase in the company's current liabilities over the period, so we would attribute some of the ROCE growth to that. Effectively this means that suppliers or short-term creditors are now funding 58% of the business, which is more than it was five years ago. And with current liabilities at those levels, that's pretty high.
In Conclusion...
In summary, it's great to see that Hong Kong Shanghai Alliance Holdings has been able to turn things around and earn higher returns on lower amounts of capital. Given the stock has declined 44% in the last five years, this could be a good investment if the valuation and other metrics are also appealing. That being the case, research into the company's current valuation metrics and future prospects seems fitting.
One more thing: We've identified 3 warning signs with Hong Kong Shanghai Alliance Holdings (at least 1 which is concerning) , and understanding these would certainly be useful.
While Hong Kong Shanghai Alliance Holdings isn't earning the highest return, check out this free list of companies that are earning high returns on equity with solid balance sheets.
Valuation is complex, but we're here to simplify it.
Discover if Hong Kong Shanghai Alliance Holdings might be undervalued or overvalued with our detailed analysis, featuring fair value estimates, potential risks, dividends, insider trades, and its financial condition.
Access Free AnalysisHave feedback on this article? Concerned about the content? Get in touch with us directly. Alternatively, email editorial-team (at) simplywallst.com.
This article by Simply Wall St is general in nature. We provide commentary based on historical data and analyst forecasts only using an unbiased methodology and our articles are not intended to be financial advice. It does not constitute a recommendation to buy or sell any stock, and does not take account of your objectives, or your financial situation. We aim to bring you long-term focused analysis driven by fundamental data. Note that our analysis may not factor in the latest price-sensitive company announcements or qualitative material. Simply Wall St has no position in any stocks mentioned.
About SEHK:1001
Hong Kong Shanghai Alliance Holdings
Engages in the distribution and processing of construction materials in Hong Kong and Mainland China.
Good value average dividend payer.
Market Insights

Advertisement
Community Narratives
MINISO's fair value is projected at 26.69 with an anticipated PE ratio shift of 20x
Fair Value US$24.03|11.0% undervalued
BE
Community Contributor
Procter & Gamble: A Dividend Giant Facing Slowing Growth
Fair Value US$119.81|23.3% overvalued
AN
Community Contributor
Eli Lilly's Future Growth Driven by Tirzepatide and Favorable Market Conditions
Fair Value US$1.19k|13.8% undervalued
EA
Community Contributor