Stock Analysis
Investors five-year losses continue as Bank of Tianjin (HKG:1578) dips a further 4.9% this week, earnings continue to decline


Statistically speaking, long term investing is a profitable endeavour. But unfortunately, some companies simply don't succeed. For example, after five long years the Bank of Tianjin Co., Ltd. (HKG:1578) share price is a whole 59% lower. That is extremely sub-optimal, to say the least.
With the stock having lost 4.9% in the past week, it's worth taking a look at business performance and seeing if there's any red flags.
View our latest analysis for Bank of Tianjin
While the efficient markets hypothesis continues to be taught by some, it has been proven that markets are over-reactive dynamic systems, and investors are not always rational. One way to examine how market sentiment has changed over time is to look at the interaction between a company's share price and its earnings per share (EPS).
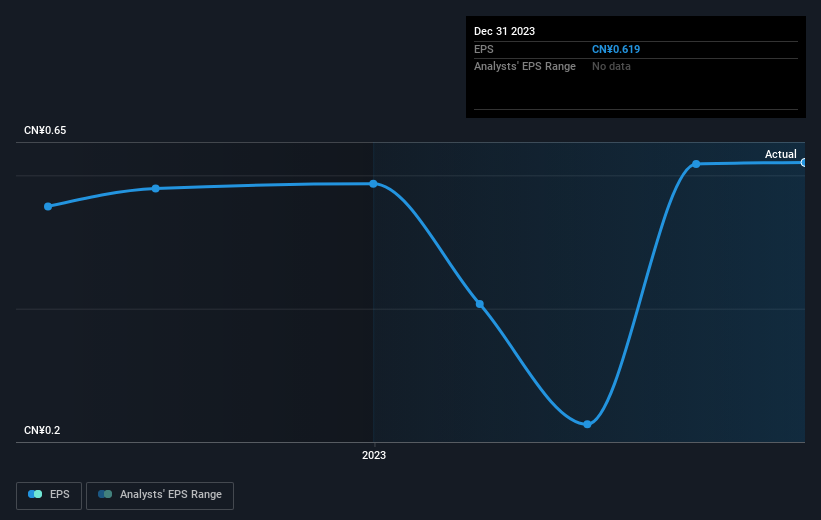
During the five years over which the share price declined, Bank of Tianjin's earnings per share (EPS) dropped by 2.1% each year. Readers should note that the share price has fallen faster than the EPS, at a rate of 16% per year, over the period. This implies that the market was previously too optimistic about the stock. The low P/E ratio of 2.63 further reflects this reticence.
The image below shows how EPS has tracked over time (if you click on the image you can see greater detail).
We're pleased to report that the CEO is remunerated more modestly than most CEOs at similarly capitalized companies. But while CEO remuneration is always worth checking, the really important question is whether the company can grow earnings going forward. Dive deeper into the earnings by checking this interactive graph of Bank of Tianjin's earnings, revenue and cash flow.
What About Dividends?
It is important to consider the total shareholder return, as well as the share price return, for any given stock. Whereas the share price return only reflects the change in the share price, the TSR includes the value of dividends (assuming they were reinvested) and the benefit of any discounted capital raising or spin-off. It's fair to say that the TSR gives a more complete picture for stocks that pay a dividend. We note that for Bank of Tianjin the TSR over the last 5 years was -53%, which is better than the share price return mentioned above. And there's no prize for guessing that the dividend payments largely explain the divergence!
A Different Perspective
Bank of Tianjin provided a TSR of 2.7% over the last twelve months. But that return falls short of the market. But at least that's still a gain! Over five years the TSR has been a reduction of 9% per year, over five years. It could well be that the business is stabilizing. It's always interesting to track share price performance over the longer term. But to understand Bank of Tianjin better, we need to consider many other factors. Take risks, for example - Bank of Tianjin has 2 warning signs (and 1 which shouldn't be ignored) we think you should know about.
Of course Bank of Tianjin may not be the best stock to buy. So you may wish to see this free collection of growth stocks.
Please note, the market returns quoted in this article reflect the market weighted average returns of stocks that currently trade on Hong Kong exchanges.
Valuation is complex, but we're helping make it simple.
Find out whether Bank of Tianjin is potentially over or undervalued by checking out our comprehensive analysis, which includes fair value estimates, risks and warnings, dividends, insider transactions and financial health.
View the Free AnalysisHave feedback on this article? Concerned about the content? Get in touch with us directly. Alternatively, email editorial-team (at) simplywallst.com.
This article by Simply Wall St is general in nature. We provide commentary based on historical data and analyst forecasts only using an unbiased methodology and our articles are not intended to be financial advice. It does not constitute a recommendation to buy or sell any stock, and does not take account of your objectives, or your financial situation. We aim to bring you long-term focused analysis driven by fundamental data. Note that our analysis may not factor in the latest price-sensitive company announcements or qualitative material. Simply Wall St has no position in any stocks mentioned.
About SEHK:1578
Bank of Tianjin
Provides a range of banking and related financial services primarily in the People’s Republic of China.
Flawless balance sheet and good value.
