
Advertisement
- Hong Kong
- /
- Auto Components
- /
- SEHK:1316
Investors one-year returns in Nexteer Automotive Group (HKG:1316) have not grown faster than the company's underlying earnings growth
The most you can lose on any stock (assuming you don't use leverage) is 100% of your money. On the other hand, if you find a high quality business to buy (at the right price) you can more than double your money! For example, the Nexteer Automotive Group Limited (HKG:1316) share price has soared 124% in the last 1 year. Most would be very happy with that, especially in just one year! Unfortunately, though, the stock has dropped 9.4% over a week. And shareholders have also done well over the long term, with an increase of 30% in the last three years.
While the stock has fallen 9.4% this week, it's worth focusing on the longer term and seeing if the stocks historical returns have been driven by the underlying fundamentals.
While markets are a powerful pricing mechanism, share prices reflect investor sentiment, not just underlying business performance. One flawed but reasonable way to assess how sentiment around a company has changed is to compare the earnings per share (EPS) with the share price.
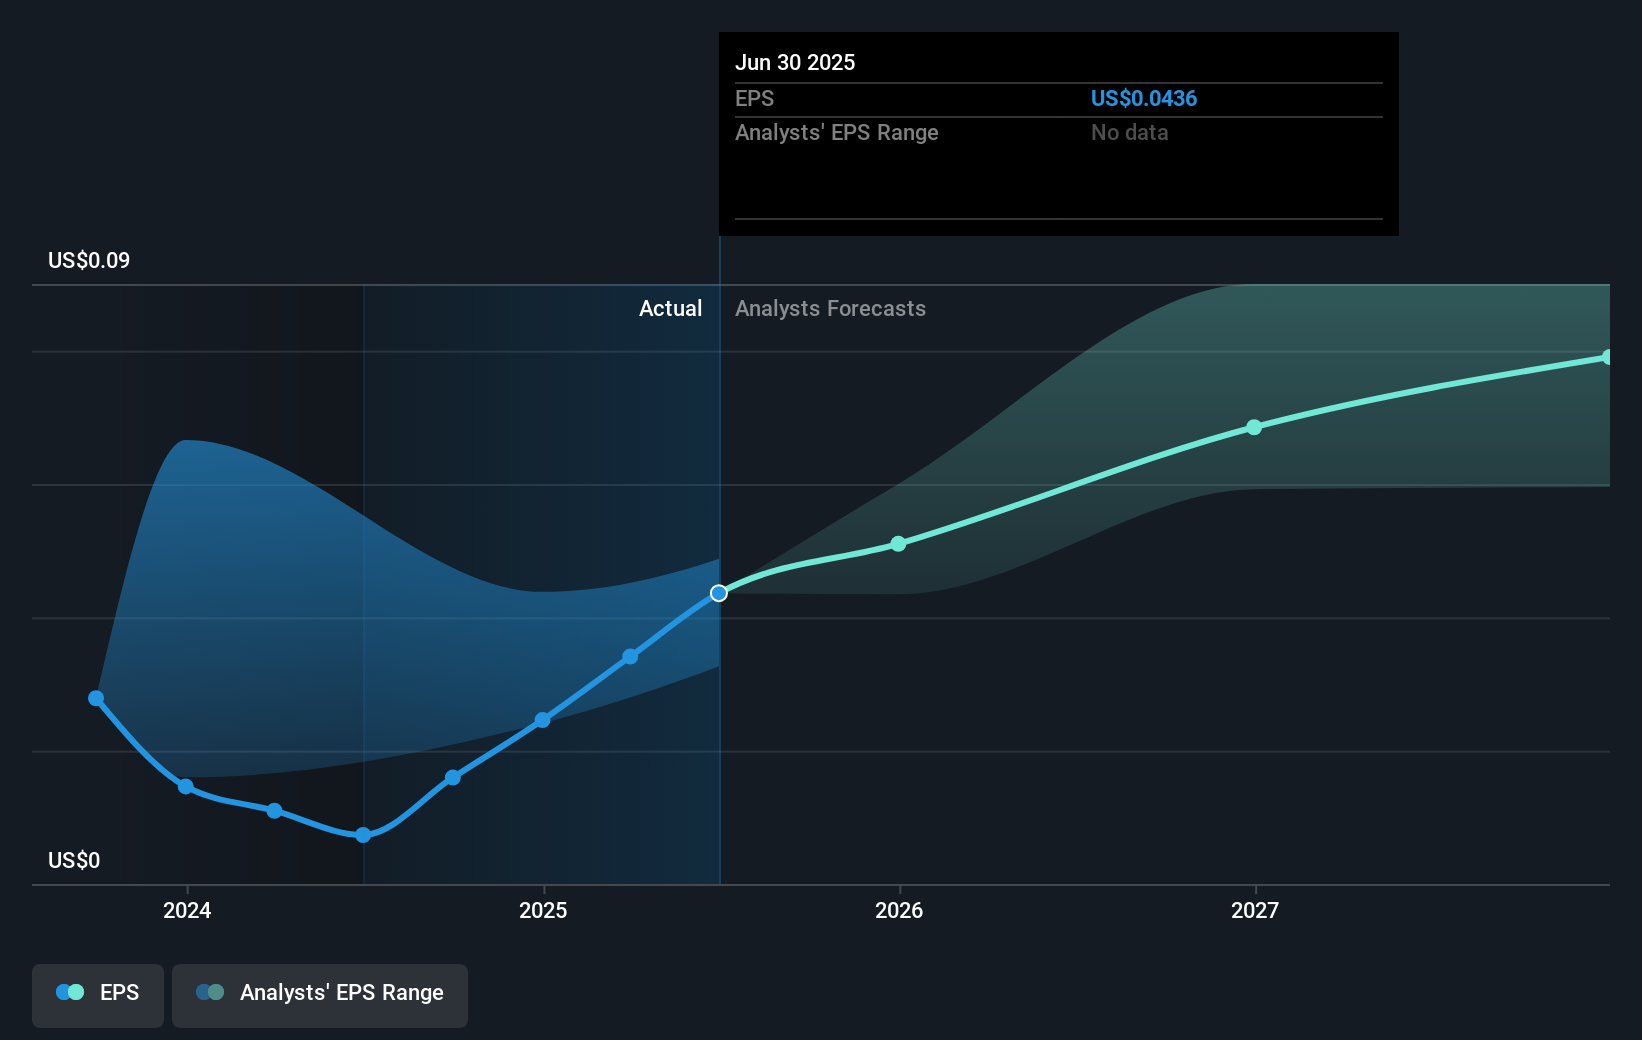
Nexteer Automotive Group boasted truly magnificent EPS growth in the last year. We don't think the exact number is a good guide to the sustainable growth rate, but we do think this sort of increase is impressive. So we're unsurprised to see the share price gaining ground. We're real advocates of letting inflection points like this guide our research as stock pickers.
You can see below how EPS has changed over time (discover the exact values by clicking on the image).
We know that Nexteer Automotive Group has improved its bottom line over the last three years, but what does the future have in store? You can see how its balance sheet has strengthened (or weakened) over time in this free interactive graphic.
What About Dividends?
As well as measuring the share price return, investors should also consider the total shareholder return (TSR). Whereas the share price return only reflects the change in the share price, the TSR includes the value of dividends (assuming they were reinvested) and the benefit of any discounted capital raising or spin-off. So for companies that pay a generous dividend, the TSR is often a lot higher than the share price return. In the case of Nexteer Automotive Group, it has a TSR of 127% for the last 1 year. That exceeds its share price return that we previously mentioned. This is largely a result of its dividend payments!
A Different Perspective
It's good to see that Nexteer Automotive Group has rewarded shareholders with a total shareholder return of 127% in the last twelve months. And that does include the dividend. There's no doubt those recent returns are much better than the TSR loss of 2% per year over five years. The long term loss makes us cautious, but the short term TSR gain certainly hints at a brighter future. Before forming an opinion on Nexteer Automotive Group you might want to consider these 3 valuation metrics.
But note: Nexteer Automotive Group may not be the best stock to buy. So take a peek at this free list of interesting companies with past earnings growth (and further growth forecast).
Please note, the market returns quoted in this article reflect the market weighted average returns of stocks that currently trade on Hong Kong exchanges.
Valuation is complex, but we're here to simplify it.
Discover if Nexteer Automotive Group might be undervalued or overvalued with our detailed analysis, featuring fair value estimates, potential risks, dividends, insider trades, and its financial condition.
Access Free AnalysisHave feedback on this article? Concerned about the content? Get in touch with us directly. Alternatively, email editorial-team (at) simplywallst.com.
This article by Simply Wall St is general in nature. We provide commentary based on historical data and analyst forecasts only using an unbiased methodology and our articles are not intended to be financial advice. It does not constitute a recommendation to buy or sell any stock, and does not take account of your objectives, or your financial situation. We aim to bring you long-term focused analysis driven by fundamental data. Note that our analysis may not factor in the latest price-sensitive company announcements or qualitative material. Simply Wall St has no position in any stocks mentioned.
About SEHK:1316
Nexteer Automotive Group
A motion control technology company, develops, manufactures, and supplies steering and driveline systems to original equipment manufacturer worldwide.
Flawless balance sheet with proven track record.
Similar Companies
Market Insights

Advertisement
Community Narratives
MINISO's fair value is projected at 26.69 with an anticipated PE ratio shift of 20x
Fair Value US$24.03|11.4% undervalued
BE
Community Contributor
Procter & Gamble: A Dividend Giant Facing Slowing Growth
Fair Value US$119.81|23.5% overvalued
AN
Community Contributor
Eli Lilly's Future Growth Driven by Tirzepatide and Favorable Market Conditions
Fair Value US$1.19k|14.0% undervalued
EA
Community Contributor