
Advertisement

Want to participate in a short research study? Help shape the future of investing tools and you could win a $250 gift card!
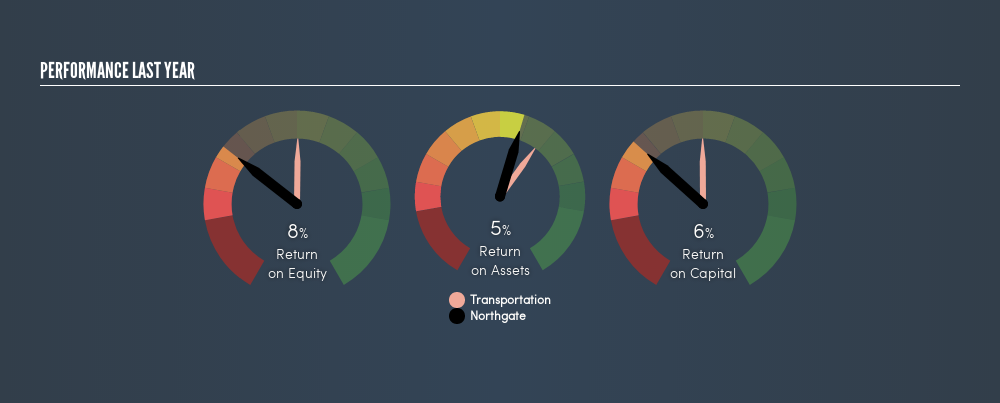
Today we are going to look at Northgate plc (LON:NTG) to see whether it might be an attractive investment prospect. In particular, we'll consider its Return On Capital Employed (ROCE), as that can give us insight into how profitably the company is able to employ capital in its business.
First of all, we'll work out how to calculate ROCE. Next, we'll compare it to others in its industry. Finally, we'll look at how its current liabilities affect its ROCE.
What is Return On Capital Employed (ROCE)?
ROCE measures the amount of pre-tax profits a company can generate from the capital employed in its business. Generally speaking a higher ROCE is better. Overall, it is a valuable metric that has its flaws. Renowned investment researcher Michael Mauboussin has suggested that a high ROCE can indicate that 'one dollar invested in the company generates value of more than one dollar'.
So, How Do We Calculate ROCE?
The formula for calculating the return on capital employed is:
Return on Capital Employed = Earnings Before Interest and Tax (EBIT) ÷ (Total Assets - Current Liabilities)
Or for Northgate:
0.062 = UK£65m ÷ (UK£1.2b - UK£158m) (Based on the trailing twelve months to October 2018.)
So, Northgate has an ROCE of 6.2%.
See our latest analysis for Northgate
Is Northgate's ROCE Good?
ROCE is commonly used for comparing the performance of similar businesses. We can see Northgate's ROCE is meaningfully below the Transportation industry average of 12%. This performance is not ideal, as it suggests the company may not be deploying its capital as effectively as some competitors. Separate from how Northgate stacks up against its industry, its ROCE in absolute terms is mediocre; relative to the returns on government bonds. It is possible that there are more rewarding investments out there.
As we can see, Northgate currently has an ROCE of 6.2%, less than the 12% it reported 3 years ago. So investors might consider if it has had issues recently.
It is important to remember that ROCE shows past performance, and is not necessarily predictive. Companies in cyclical industries can be difficult to understand using ROCE, as returns typically look high during boom times, and low during busts. This is because ROCE only looks at one year, instead of considering returns across a whole cycle. Future performance is what matters, and you can see analyst predictions in our free report on analyst forecasts for the company.
What Are Current Liabilities, And How Do They Affect Northgate's ROCE?
Current liabilities are short term bills and invoices that need to be paid in 12 months or less. The ROCE equation subtracts current liabilities from capital employed, so a company with a lot of current liabilities appears to have less capital employed, and a higher ROCE than otherwise. To check the impact of this, we calculate if a company has high current liabilities relative to its total assets.
Northgate has total liabilities of UK£158m and total assets of UK£1.2b. Therefore its current liabilities are equivalent to approximately 13% of its total assets. This is a modest level of current liabilities, which would only have a small effect on ROCE.
What We Can Learn From Northgate's ROCE
With that in mind, we're not overly impressed with Northgate's ROCE, so it may not be the most appealing prospect. Of course, you might find a fantastic investment by looking at a few good candidates. So take a peek at this free list of companies with modest (or no) debt, trading on a P/E below 20.
If you like to buy stocks alongside management, then you might just love this free list of companies. (Hint: insiders have been buying them).
We aim to bring you long-term focused research analysis driven by fundamental data. Note that our analysis may not factor in the latest price-sensitive company announcements or qualitative material.
If you spot an error that warrants correction, please contact the editor at editorial-team@simplywallst.com. This article by Simply Wall St is general in nature. It does not constitute a recommendation to buy or sell any stock, and does not take account of your objectives, or your financial situation. Simply Wall St has no position in the stocks mentioned. Thank you for reading.
About LSE:ZIG
Zigup
Engages in the provision of mobility solutions and automotive services to business and personal customers in the United Kingdom, Spain, and Ireland.
Undervalued established dividend payer.
Market Insights

Advertisement
Community Narratives
Vita Life Sciences Set for a 12.72% Revenue Growth While Tackling Operational Challenges
Fair Value AU$2.42|8.7% undervalued
RO
Community Contributor
Vossloh rides a €500 billion wave to boost growth and earnings in the next decade
Fair Value €78.41|6.3% undervalued
CH
Community Contributor
Intuitive Surgical Will Transform Healthcare with 12% Revenue Growth
Fair Value US$325.55|56.5% overvalued
UN
Community Contributor