Advertisement
- United Kingdom
- /
- Wireless Telecom
- /
- LSE:VOD
Is Vodafone Stock a Bargain After Deutsche Telekom Merger Talks in 2025?

Simply Wall St
Reviewed by Bailey Pemberton
Looking at Vodafone Group stock and wondering whether now is the right time to take action? You are not alone. Investors across the market are asking the same question, especially with Vodafone’s share price making some notable moves this year. After a slight dip of 1.4% in the past week and a 3.9% pullback over the past month, it might seem like the excitement has faded. However, taking a broader view shows a different picture: Vodafone is up 22.6% year-to-date and 19.5% in the past year. These returns suggest there may have been a significant shift in how the market views Vodafone, possibly reflecting renewed optimism about its strategy and improving fundamentals.
Global telecom stocks like Vodafone often spark debate about true value, and news of ongoing industry transformation, infrastructure investments, and expansion into new technology has only intensified the discussion. With this context, Vodafone currently posts a solid value score of 5 out of 6, based on checks for undervaluation, which can be a strong signal for anyone weighing their options.
So, how does Vodafone’s current price compare to its intrinsic worth? Next, we will walk through the main valuation methods investors use to cut through the noise and find genuine opportunity. But stay tuned, because at the end, I will highlight a smarter way to gauge value that goes beyond the usual numbers.
Why Vodafone Group is lagging behind its peers
Approach 1: Vodafone Group Discounted Cash Flow (DCF) Analysis
A Discounted Cash Flow (DCF) model projects a company’s expected future cash flows and then discounts those future values back to today's terms to estimate the business’s intrinsic worth. This method is particularly useful for companies like Vodafone Group, where reliable cash flow generation is a key investment focus.
Vodafone’s most recent trailing twelve months Free Cash Flow sits at €8.24 Billion. Looking ahead, analysts and projections estimate that by 2030, Vodafone’s annual Free Cash Flow could reach €3.76 Billion. The ten-year forecast maps out a path from €2.15 Billion in 2026, with gradual growth each year supported by industry and internal assumptions.
Based on this DCF analysis, Vodafone’s estimated intrinsic value is £2.10 per share. This is significantly higher than its current market price, which implies the stock is trading at a 59.8% discount.
In summary, the market appears to be pricing in less optimism than Vodafone’s long-term cash flow potential may indicate.
Result: UNDERVALUED
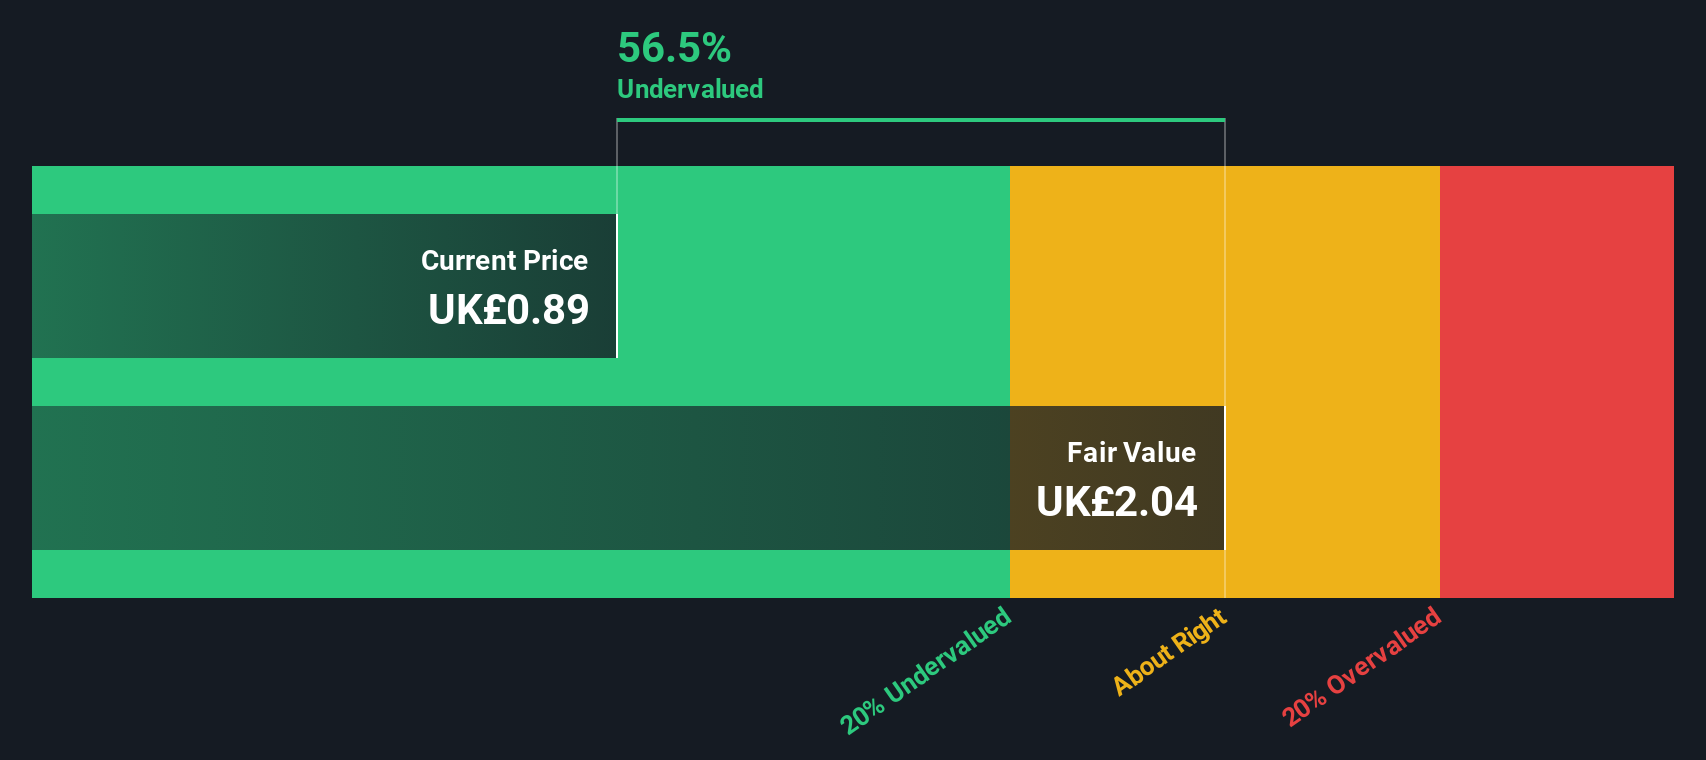
Our Discounted Cash Flow (DCF) analysis suggests Vodafone Group is undervalued by 59.8%. Track this in your watchlist or portfolio, or discover more undervalued stocks.
Approach 2: Vodafone Group Price vs Sales
While there are many ways to assess a company's value, the Price-to-Sales (P/S) ratio stands out as a reliable metric for telecom operators like Vodafone Group, especially when profitability fluctuates or net income is less predictable. The P/S ratio provides a clear view of how the market values each pound of revenue the business generates. This makes it well-suited for companies with steady sales but variable earnings.
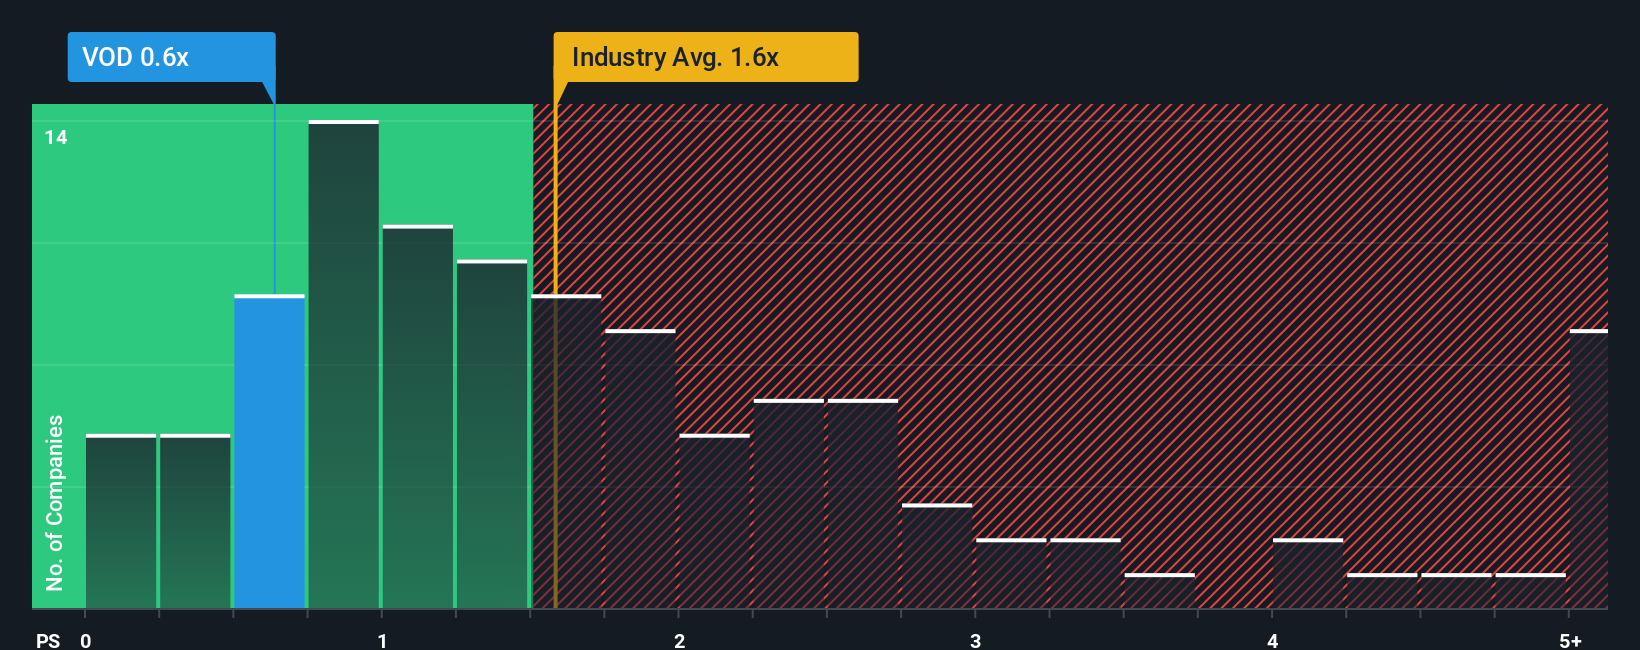
Understanding a “fair” P/S multiple involves more than looking up an industry average. Higher expected sales growth or lower risk could justify a higher P/S ratio, whereas lower growth, margin pressure, or market risks would typically support a lower multiple. Context matters. For Vodafone, the current P/S ratio is 0.62x, which is noticeably below both the Wireless Telecom industry average of 1.54x and the peer average of 1.87x.
To offer a more nuanced perspective, Simply Wall St’s proprietary Fair Ratio estimates what a reasonable P/S multiple for Vodafone should be given its specific growth trends, profit margins, market cap, and industry risk profile. Unlike peer or industry comparisons, which paint with broad strokes, the Fair Ratio tailors its analysis to Vodafone’s own characteristics and outlook. For Vodafone Group, this Fair Ratio stands at 1.79x, well above its actual P/S of 0.62x, signaling strong relative undervaluation.
Result: UNDERVALUED
PS ratios tell one story, but what if the real opportunity lies elsewhere? Discover companies where insiders are betting big on explosive growth.
Upgrade Your Decision Making: Choose your Vodafone Group Narrative
Earlier, we mentioned there was an even better way to understand valuation, so let's introduce you to Narratives. A Narrative is your unique story about a company. It connects what you believe about Vodafone Group’s future (its strategy, expected revenue, and margins) to a concrete financial forecast and an estimated fair value.
Unlike traditional ratios or modeling approaches, Narratives let you articulate why you think Vodafone is undervalued or overvalued based on real business events, challenges, and catalysts. This holistic approach is simple, interactive, and accessible via the Community page on Simply Wall St, where millions of investors share and explore Narratives every day.
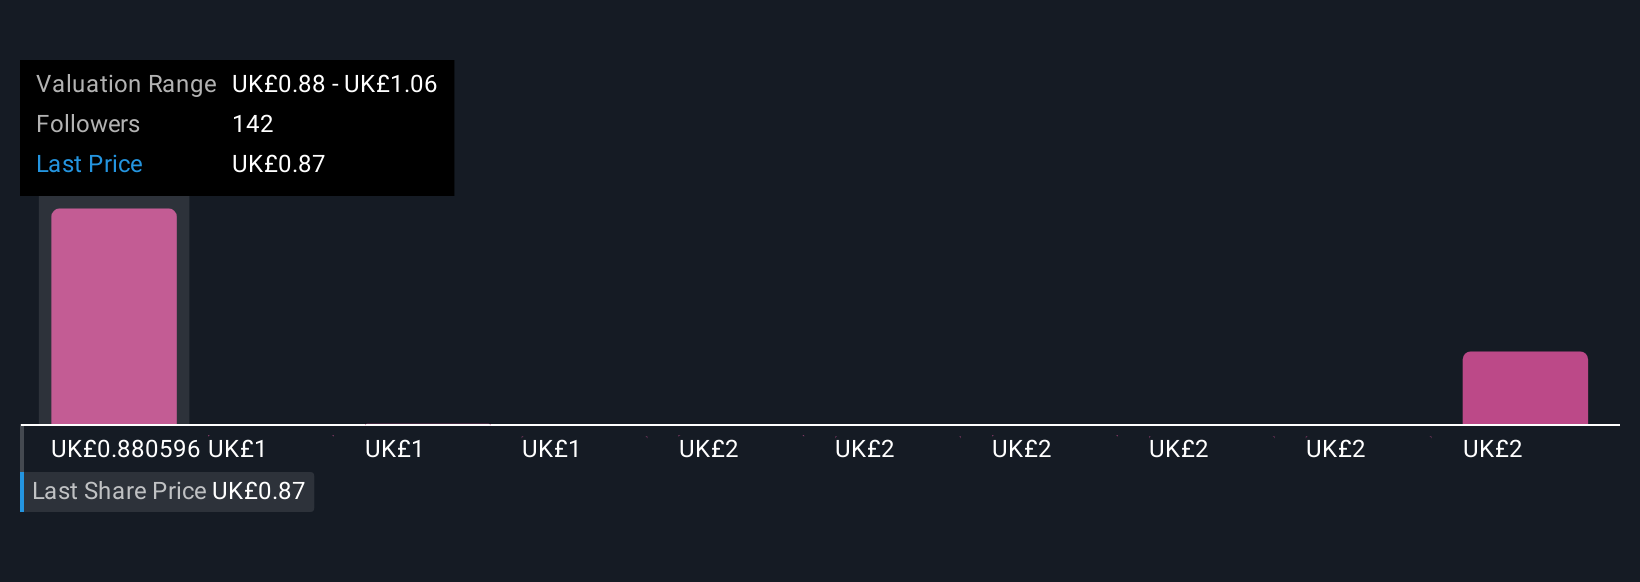
Narratives make decision making smarter by helping you compare your calculated Fair Value with the latest market Price. Since they update automatically when news or earnings are released, your perspective stays fresh. For Vodafone Group, you might see one Narrative focused on digital partnerships and financial flexibility suggesting a fair value of £1.36, while a more cautious view based on operational challenges in Germany proposes £0.60. With Narratives, your investment story drives your actions, making it easier to buy or sell confidently as the facts evolve.
Do you think there's more to the story for Vodafone Group? Create your own Narrative to let the Community know!
This article by Simply Wall St is general in nature. We provide commentary based on historical data and analyst forecasts only using an unbiased methodology and our articles are not intended to be financial advice. It does not constitute a recommendation to buy or sell any stock, and does not take account of your objectives, or your financial situation. We aim to bring you long-term focused analysis driven by fundamental data. Note that our analysis may not factor in the latest price-sensitive company announcements or qualitative material. Simply Wall St has no position in any stocks mentioned.
New: Manage All Your Stock Portfolios in One Place
We've created the ultimate portfolio companion for stock investors, and it's free.
• Connect an unlimited number of Portfolios and see your total in one currency
• Be alerted to new Warning Signs or Risks via email or mobile
• Track the Fair Value of your stocks
Have feedback on this article? Concerned about the content? Get in touch with us directly. Alternatively, email editorial-team@simplywallst.com
About LSE:VOD
Vodafone Group
Provides telecommunication services in Germany, the United Kingdom, rest of Europe, Turkey, and South Africa.
Undervalued with adequate balance sheet.
Similar Companies
Market Insights

Advertisement
Community Narratives
The company that turned a verb into a global necessity and basically runs the modern internet, digital ads, smartphones, maps, and AI.
Fair Value US$300.00|7.5% undervalued
OS
Community Contributor
Flowers Foods Pays A Fair Price For Health
Fair Value US$16.12|25.4% undervalued
NV
Community Contributor
TMX Group will thrive with 33.3% profit margin and enduring market moat
Fair Value CA$49.90|3.6% overvalued
LI
Community Contributor
The "Molecular Pencil": Why Beam's Technology is Built to Win
Fair Value US$65.01|65.0% undervalued
DA
Community Contributor