
Advertisement
Howard Marks put it nicely when he said that, rather than worrying about share price volatility, 'The possibility of permanent loss is the risk I worry about... and every practical investor I know worries about.' When we think about how risky a company is, we always like to look at its use of debt, since debt overload can lead to ruin. As with many other companies Xaar plc (LON:XAR) makes use of debt. But the more important question is: how much risk is that debt creating?
What Risk Does Debt Bring?
Generally speaking, debt only becomes a real problem when a company can't easily pay it off, either by raising capital or with its own cash flow. If things get really bad, the lenders can take control of the business. While that is not too common, we often do see indebted companies permanently diluting shareholders because lenders force them to raise capital at a distressed price. By replacing dilution, though, debt can be an extremely good tool for businesses that need capital to invest in growth at high rates of return. The first step when considering a company's debt levels is to consider its cash and debt together.
See our latest analysis for Xaar
How Much Debt Does Xaar Carry?
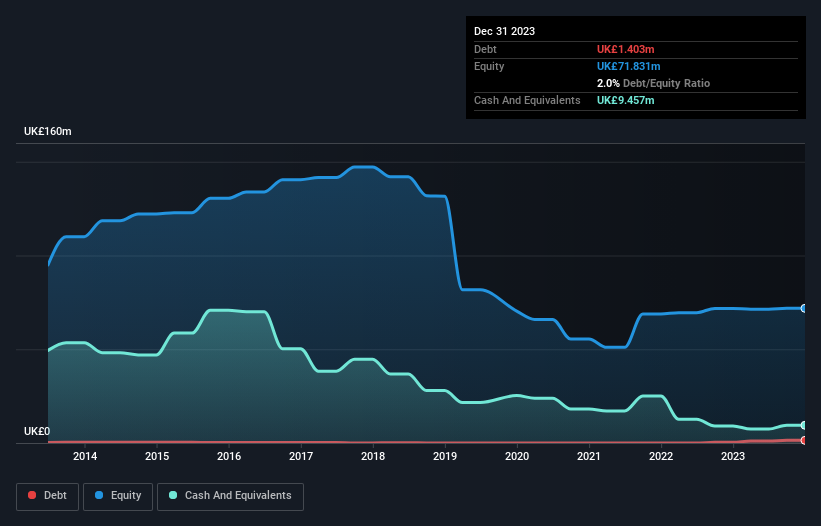
You can click the graphic below for the historical numbers, but it shows that as of December 2023 Xaar had UK£1.40m of debt, an increase on UK£379.0k, over one year. However, it does have UK£9.46m in cash offsetting this, leading to net cash of UK£8.05m.
How Strong Is Xaar's Balance Sheet?
The latest balance sheet data shows that Xaar had liabilities of UK£18.2m due within a year, and liabilities of UK£7.20m falling due after that. Offsetting this, it had UK£9.46m in cash and UK£10.0m in receivables that were due within 12 months. So it has liabilities totalling UK£5.95m more than its cash and near-term receivables, combined.
Of course, Xaar has a market capitalization of UK£100.3m, so these liabilities are probably manageable. Having said that, it's clear that we should continue to monitor its balance sheet, lest it change for the worse. Despite its noteworthy liabilities, Xaar boasts net cash, so it's fair to say it does not have a heavy debt load! There's no doubt that we learn most about debt from the balance sheet. But it is future earnings, more than anything, that will determine Xaar's ability to maintain a healthy balance sheet going forward. So if you want to see what the professionals think, you might find this free report on analyst profit forecasts to be interesting.
Over 12 months, Xaar made a loss at the EBIT level, and saw its revenue drop to UK£71m, which is a fall of 3.0%. That's not what we would hope to see.
So How Risky Is Xaar?
We have no doubt that loss making companies are, in general, riskier than profitable ones. And in the last year Xaar had an earnings before interest and tax (EBIT) loss, truth be told. And over the same period it saw negative free cash outflow of UK£629k and booked a UK£2.2m accounting loss. Given it only has net cash of UK£8.05m, the company may need to raise more capital if it doesn't reach break-even soon. Overall, we'd say the stock is a bit risky, and we're usually very cautious until we see positive free cash flow. For riskier companies like Xaar I always like to keep an eye on the long term profit and revenue trends. Fortunately, you can click to see our interactive graph of its profit, revenue, and operating cashflow.
If you're interested in investing in businesses that can grow profits without the burden of debt, then check out this free list of growing businesses that have net cash on the balance sheet.
New: AI Stock Screener & Alerts
Our new AI Stock Screener scans the market every day to uncover opportunities.
• Dividend Powerhouses (3%+ Yield)
• Undervalued Small Caps with Insider Buying
• High growth Tech and AI Companies
Or build your own from over 50 metrics.
Have feedback on this article? Concerned about the content? Get in touch with us directly. Alternatively, email editorial-team (at) simplywallst.com.
This article by Simply Wall St is general in nature. We provide commentary based on historical data and analyst forecasts only using an unbiased methodology and our articles are not intended to be financial advice. It does not constitute a recommendation to buy or sell any stock, and does not take account of your objectives, or your financial situation. We aim to bring you long-term focused analysis driven by fundamental data. Note that our analysis may not factor in the latest price-sensitive company announcements or qualitative material. Simply Wall St has no position in any stocks mentioned.
About LSE:XAR
Xaar
Designs, develops, manufactures, markets, and sells industrial printheads and print systems in Europe, the Middle East, Africa, Asia, and the Americas.
Flawless balance sheet with reasonable growth potential.
Market Insights

Advertisement
Community Narratives
MicroVision will explode future revenue by 380.37% with a vision towards success
Fair Value US$60.00|98.4% undervalued
TH
Community Contributor
The Indispensable Artery for a New North American Economy
Fair Value CA$132.87|1.3% undervalued
TI
Community Contributor