
Advertisement
These 4 Measures Indicate That Renishaw (LON:RSW) Is Using Debt Reasonably Well
David Iben put it well when he said, 'Volatility is not a risk we care about. What we care about is avoiding the permanent loss of capital.' It's only natural to consider a company's balance sheet when you examine how risky it is, since debt is often involved when a business collapses. We can see that Renishaw plc (LON:RSW) does use debt in its business. But the more important question is: how much risk is that debt creating?
When Is Debt Dangerous?
Debt and other liabilities become risky for a business when it cannot easily fulfill those obligations, either with free cash flow or by raising capital at an attractive price. Ultimately, if the company can't fulfill its legal obligations to repay debt, shareholders could walk away with nothing. However, a more common (but still painful) scenario is that it has to raise new equity capital at a low price, thus permanently diluting shareholders. Having said that, the most common situation is where a company manages its debt reasonably well - and to its own advantage. When we think about a company's use of debt, we first look at cash and debt together.
Check out our latest analysis for Renishaw
What Is Renishaw's Debt?
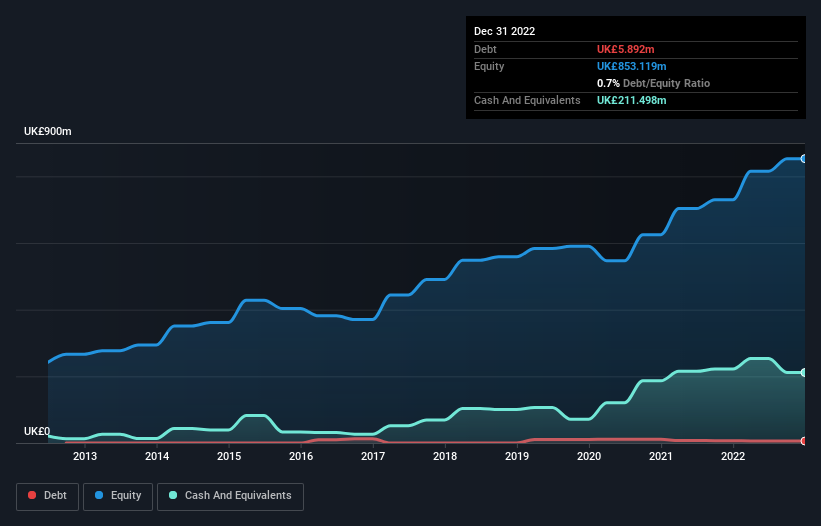
As you can see below, Renishaw had UK£5.89m of debt at December 2022, down from UK£6.89m a year prior. But on the other hand it also has UK£211.5m in cash, leading to a UK£205.6m net cash position.
A Look At Renishaw's Liabilities
Zooming in on the latest balance sheet data, we can see that Renishaw had liabilities of UK£101.8m due within 12 months and liabilities of UK£44.2m due beyond that. Offsetting this, it had UK£211.5m in cash and UK£167.2m in receivables that were due within 12 months. So it can boast UK£232.7m more liquid assets than total liabilities.
This surplus suggests that Renishaw has a conservative balance sheet, and could probably eliminate its debt without much difficulty. Succinctly put, Renishaw boasts net cash, so it's fair to say it does not have a heavy debt load!
On the other hand, Renishaw saw its EBIT drop by 5.6% in the last twelve months. If earnings continue to decline at that rate the company may have increasing difficulty managing its debt load. The balance sheet is clearly the area to focus on when you are analysing debt. But ultimately the future profitability of the business will decide if Renishaw can strengthen its balance sheet over time. So if you're focused on the future you can check out this free report showing analyst profit forecasts.
But our final consideration is also important, because a company cannot pay debt with paper profits; it needs cold hard cash. While Renishaw has net cash on its balance sheet, it's still worth taking a look at its ability to convert earnings before interest and tax (EBIT) to free cash flow, to help us understand how quickly it is building (or eroding) that cash balance. During the last three years, Renishaw produced sturdy free cash flow equating to 60% of its EBIT, about what we'd expect. This cold hard cash means it can reduce its debt when it wants to.
Summing Up
While it is always sensible to investigate a company's debt, in this case Renishaw has UK£205.6m in net cash and a decent-looking balance sheet. So we are not troubled with Renishaw's debt use. Above most other metrics, we think its important to track how fast earnings per share is growing, if at all. If you've also come to that realization, you're in luck, because today you can view this interactive graph of Renishaw's earnings per share history for free.
Of course, if you're the type of investor who prefers buying stocks without the burden of debt, then don't hesitate to discover our exclusive list of net cash growth stocks, today.
New: AI Stock Screener & Alerts
Our new AI Stock Screener scans the market every day to uncover opportunities.
• Dividend Powerhouses (3%+ Yield)
• Undervalued Small Caps with Insider Buying
• High growth Tech and AI Companies
Or build your own from over 50 metrics.
Have feedback on this article? Concerned about the content? Get in touch with us directly. Alternatively, email editorial-team (at) simplywallst.com.
This article by Simply Wall St is general in nature. We provide commentary based on historical data and analyst forecasts only using an unbiased methodology and our articles are not intended to be financial advice. It does not constitute a recommendation to buy or sell any stock, and does not take account of your objectives, or your financial situation. We aim to bring you long-term focused analysis driven by fundamental data. Note that our analysis may not factor in the latest price-sensitive company announcements or qualitative material. Simply Wall St has no position in any stocks mentioned.
About LSE:RSW
Renishaw
An engineering and scientific technology company, designs, manufactures, distributes, sells, and services technological products and services, and analytical instruments and medical devices worldwide.
Flawless balance sheet average dividend payer.
Similar Companies
Market Insights

Advertisement
Community Narratives
MicroVision will explode future revenue by 380.37% with a vision towards success
Fair Value US$60.00|98.5% undervalued
TH
Community Contributor
The Indispensable Artery for a New North American Economy
Fair Value CA$132.87|2.3% undervalued
TI
Community Contributor