Vianet Group's (LON:VNET) Returns On Capital Tell Us There Is Reason To Feel Uneasy

Ignoring the stock price of a company, what are the underlying trends that tell us a business is past the growth phase? A business that's potentially in decline often shows two trends, a return on capital employed (ROCE) that's declining, and a base of capital employed that's also declining. This indicates the company is producing less profit from its investments and its total assets are decreasing. On that note, looking into Vianet Group (LON:VNET), we weren't too upbeat about how things were going.
What Is Return On Capital Employed (ROCE)?
For those that aren't sure what ROCE is, it measures the amount of pre-tax profits a company can generate from the capital employed in its business. The formula for this calculation on Vianet Group is:
Return on Capital Employed = Earnings Before Interest and Tax (EBIT) ÷ (Total Assets - Current Liabilities)
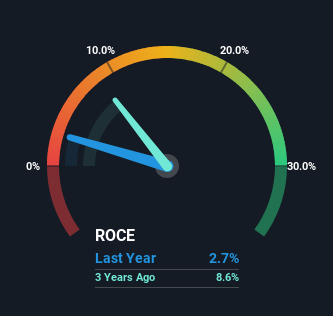
0.027 = UK£780k ÷ (UK£33m - UK£4.3m) (Based on the trailing twelve months to March 2023).
Thus, Vianet Group has an ROCE of 2.7%. Ultimately, that's a low return and it under-performs the Electronic industry average of 13%.
Check out our latest analysis for Vianet Group
In the above chart we have measured Vianet Group's prior ROCE against its prior performance, but the future is arguably more important. If you'd like, you can check out the forecasts from the analysts covering Vianet Group here for free.
So How Is Vianet Group's ROCE Trending?
In terms of Vianet Group's historical ROCE movements, the trend doesn't inspire confidence. Unfortunately the returns on capital have diminished from the 8.9% that they were earning five years ago. Meanwhile, capital employed in the business has stayed roughly the flat over the period. This combination can be indicative of a mature business that still has areas to deploy capital, but the returns received aren't as high due potentially to new competition or smaller margins. If these trends continue, we wouldn't expect Vianet Group to turn into a multi-bagger.
The Bottom Line
All in all, the lower returns from the same amount of capital employed aren't exactly signs of a compounding machine. Investors haven't taken kindly to these developments, since the stock has declined 36% from where it was five years ago. Unless there is a shift to a more positive trajectory in these metrics, we would look elsewhere.
On a separate note, we've found 2 warning signs for Vianet Group you'll probably want to know about.
While Vianet Group may not currently earn the highest returns, we've compiled a list of companies that currently earn more than 25% return on equity. Check out this free list here.
Mobile Infrastructure for Defense and Disaster
The next wave in robotics isn't humanoid. Its fully autonomous towers delivering 5G, ISR, and radar in under 30 minutes, anywhere.
Get the investor briefing before the next round of contracts
Sponsored On Behalf of CiTechNew: Manage All Your Stock Portfolios in One Place
We've created the ultimate portfolio companion for stock investors, and it's free.
• Connect an unlimited number of Portfolios and see your total in one currency
• Be alerted to new Warning Signs or Risks via email or mobile
• Track the Fair Value of your stocks
Have feedback on this article? Concerned about the content? Get in touch with us directly. Alternatively, email editorial-team (at) simplywallst.com.
This article by Simply Wall St is general in nature. We provide commentary based on historical data and analyst forecasts only using an unbiased methodology and our articles are not intended to be financial advice. It does not constitute a recommendation to buy or sell any stock, and does not take account of your objectives, or your financial situation. We aim to bring you long-term focused analysis driven by fundamental data. Note that our analysis may not factor in the latest price-sensitive company announcements or qualitative material. Simply Wall St has no position in any stocks mentioned.
About AIM:VNET
Vianet Group
Provides smart, cloud-based, and Internet of Things solutions to the hospitality, unattended retail vending, and remote asset management sectors in the United Kingdom, the rest of Europe, the United States, and Canada.
Flawless balance sheet with proven track record.
Market Insights

Weekly Picks

Early mover in a fast growing industry. Likely to experience share price volatility as they scale


A case for CA$31.80 (undiluted), aka 8,616% upside from CA$0.37 (an 86 bagger!).


Moderation and Stabilisation: HOLD: Fair Price based on a 4-year Cycle is $12.08
Recently Updated Narratives

Airbnb Stock: Platform Growth in a World of Saturation and Scrutiny

Adobe Stock: AI-Fueled ARR Growth Pushes Guidance Higher, But Cost Pressures Loom

Thomson Reuters Stock: When Legal Intelligence Becomes Mission-Critical Infrastructure
Popular Narratives


Crazy Undervalued 42 Baggers Silver Play (Active & Running Mine)


NVDA: Expanding AI Demand Will Drive Major Data Center Investments Through 2026

The AI Infrastructure Giant Grows Into Its Valuation
Trending Discussion


