
Advertisement
Returns On Capital At SDI Group (LON:SDI) Have Hit The Brakes
What are the early trends we should look for to identify a stock that could multiply in value over the long term? Amongst other things, we'll want to see two things; firstly, a growing return on capital employed (ROCE) and secondly, an expansion in the company's amount of capital employed. Ultimately, this demonstrates that it's a business that is reinvesting profits at increasing rates of return. In light of that, when we looked at SDI Group (LON:SDI) and its ROCE trend, we weren't exactly thrilled.
Return On Capital Employed (ROCE): What Is It?
Just to clarify if you're unsure, ROCE is a metric for evaluating how much pre-tax income (in percentage terms) a company earns on the capital invested in its business. Analysts use this formula to calculate it for SDI Group:
Return on Capital Employed = Earnings Before Interest and Tax (EBIT) ÷ (Total Assets - Current Liabilities)
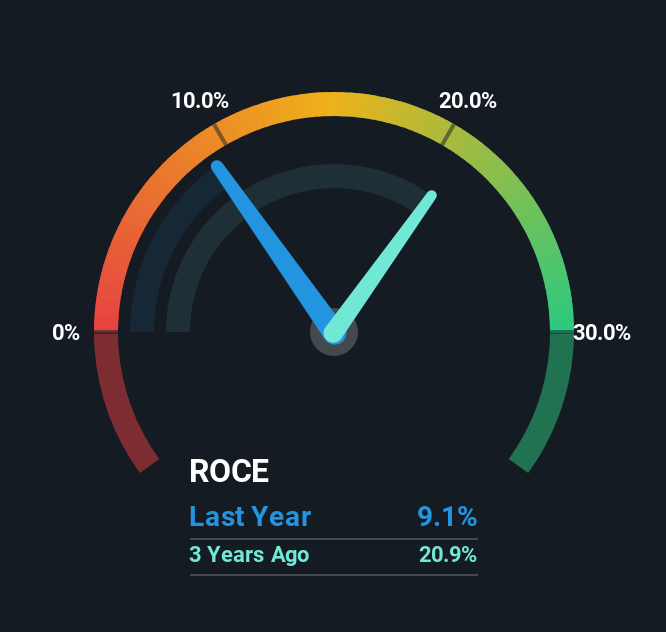
0.091 = UK£6.9m ÷ (UK£88m - UK£12m) (Based on the trailing twelve months to April 2025).
So, SDI Group has an ROCE of 9.1%. On its own that's a low return on capital but it's in line with the industry's average returns of 9.3%.
See our latest analysis for SDI Group
In the above chart we have measured SDI Group's prior ROCE against its prior performance, but the future is arguably more important. If you'd like, you can check out the forecasts from the analysts covering SDI Group for free.
What Does the ROCE Trend For SDI Group Tell Us?
The returns on capital haven't changed much for SDI Group in recent years. Over the past five years, ROCE has remained relatively flat at around 9.1% and the business has deployed 133% more capital into its operations. Given the company has increased the amount of capital employed, it appears the investments that have been made simply don't provide a high return on capital.
The Bottom Line
In summary, SDI Group has simply been reinvesting capital and generating the same low rate of return as before. And in the last five years, the stock has given away 15% so the market doesn't look too hopeful on these trends strengthening any time soon. All in all, the inherent trends aren't typical of multi-baggers, so if that's what you're after, we think you might have more luck elsewhere.
On a final note, we found 2 warning signs for SDI Group (1 is a bit concerning) you should be aware of.
While SDI Group isn't earning the highest return, check out this free list of companies that are earning high returns on equity with solid balance sheets.
New: Manage All Your Stock Portfolios in One Place
We've created the ultimate portfolio companion for stock investors, and it's free.
• Connect an unlimited number of Portfolios and see your total in one currency
• Be alerted to new Warning Signs or Risks via email or mobile
• Track the Fair Value of your stocks
Have feedback on this article? Concerned about the content? Get in touch with us directly. Alternatively, email editorial-team (at) simplywallst.com.
This article by Simply Wall St is general in nature. We provide commentary based on historical data and analyst forecasts only using an unbiased methodology and our articles are not intended to be financial advice. It does not constitute a recommendation to buy or sell any stock, and does not take account of your objectives, or your financial situation. We aim to bring you long-term focused analysis driven by fundamental data. Note that our analysis may not factor in the latest price-sensitive company announcements or qualitative material. Simply Wall St has no position in any stocks mentioned.
About AIM:SDI
SDI Group
Designs and manufactures scientific and technology products based on digital imaging and sensing and control applications worldwide.
Excellent balance sheet and slightly overvalued.
Market Insights

Advertisement
Community Narratives
MINISO's fair value is projected at 26.69 with an anticipated PE ratio shift of 20x
Fair Value US$24.03|9.0% undervalued
BE
Community Contributor
Procter & Gamble: A Dividend Giant Facing Slowing Growth
Fair Value US$119.81|23.5% overvalued
AN
Community Contributor
Eli Lilly's Future Growth Driven by Tirzepatide and Favorable Market Conditions
Fair Value US$1.19k|14.4% undervalued
EA
Community Contributor