
Advertisement
- United Kingdom
- /
- Communications
- /
- AIM:CLX
Investors Could Be Concerned With Calnex Solutions' (LON:CLX) Returns On Capital
There are a few key trends to look for if we want to identify the next multi-bagger. Amongst other things, we'll want to see two things; firstly, a growing return on capital employed (ROCE) and secondly, an expansion in the company's amount of capital employed. Put simply, these types of businesses are compounding machines, meaning they are continually reinvesting their earnings at ever-higher rates of return. However, after investigating Calnex Solutions (LON:CLX), we don't think it's current trends fit the mold of a multi-bagger.
Understanding Return On Capital Employed (ROCE)
If you haven't worked with ROCE before, it measures the 'return' (pre-tax profit) a company generates from capital employed in its business. Analysts use this formula to calculate it for Calnex Solutions:
Return on Capital Employed = Earnings Before Interest and Tax (EBIT) ÷ (Total Assets - Current Liabilities)
0.11 = UK£3.4m ÷ (UK£37m - UK£5.8m) (Based on the trailing twelve months to September 2023).
Thus, Calnex Solutions has an ROCE of 11%. In isolation, that's a pretty standard return but against the Communications industry average of 16%, it's not as good.
See our latest analysis for Calnex Solutions
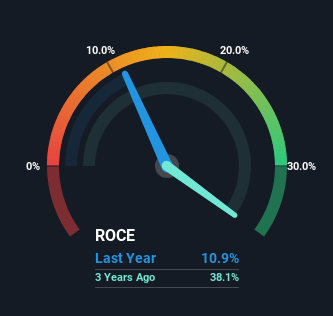
Above you can see how the current ROCE for Calnex Solutions compares to its prior returns on capital, but there's only so much you can tell from the past. If you're interested, you can view the analysts predictions in our free report on analyst forecasts for the company.
What Can We Tell From Calnex Solutions' ROCE Trend?
When we looked at the ROCE trend at Calnex Solutions, we didn't gain much confidence. Over the last five years, returns on capital have decreased to 11% from 16% five years ago. And considering revenue has dropped while employing more capital, we'd be cautious. This could mean that the business is losing its competitive advantage or market share, because while more money is being put into ventures, it's actually producing a lower return - "less bang for their buck" per se.
The Bottom Line
From the above analysis, we find it rather worrisome that returns on capital and sales for Calnex Solutions have fallen, meanwhile the business is employing more capital than it was five years ago. Long term shareholders who've owned the stock over the last three years have experienced a 23% depreciation in their investment, so it appears the market might not like these trends either. That being the case, unless the underlying trends revert to a more positive trajectory, we'd consider looking elsewhere.
One final note, you should learn about the 5 warning signs we've spotted with Calnex Solutions (including 3 which are concerning) .
For those who like to invest in solid companies, check out this free list of companies with solid balance sheets and high returns on equity.
New: AI Stock Screener & Alerts
Our new AI Stock Screener scans the market every day to uncover opportunities.
• Dividend Powerhouses (3%+ Yield)
• Undervalued Small Caps with Insider Buying
• High growth Tech and AI Companies
Or build your own from over 50 metrics.
Have feedback on this article? Concerned about the content? Get in touch with us directly. Alternatively, email editorial-team (at) simplywallst.com.
This article by Simply Wall St is general in nature. We provide commentary based on historical data and analyst forecasts only using an unbiased methodology and our articles are not intended to be financial advice. It does not constitute a recommendation to buy or sell any stock, and does not take account of your objectives, or your financial situation. We aim to bring you long-term focused analysis driven by fundamental data. Note that our analysis may not factor in the latest price-sensitive company announcements or qualitative material. Simply Wall St has no position in any stocks mentioned.
About AIM:CLX
Calnex Solutions
Designs, produces, and markets test and measurement instrumentation and solutions for the telecoms and cloud computing industries in the Americas, North Asia, and internationally.
Flawless balance sheet with reasonable growth potential.
Market Insights

Advertisement
Community Narratives
MicroVision will explode future revenue by 380.37% with a vision towards success
Fair Value US$60.00|98.3% undervalued
TH
Community Contributor
The Indispensable Artery for a New North American Economy
Fair Value CA$132.87|2.3% undervalued
TI
Community Contributor