- United Kingdom
- /
- IT
- /
- LSE:FDM
Investors Don't See Light At End Of FDM Group (Holdings) plc's (LON:FDM) Tunnel
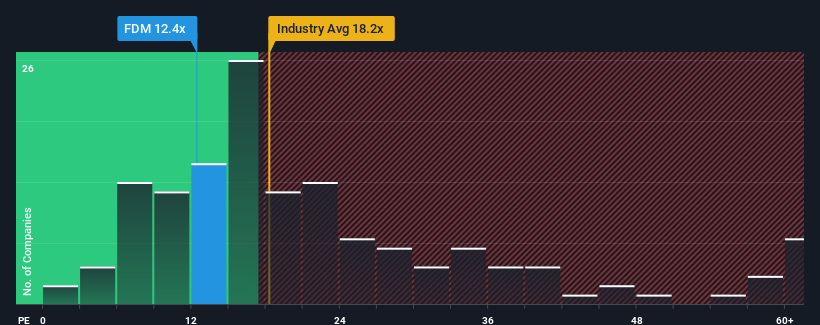
With a price-to-earnings (or "P/E") ratio of 12.4x FDM Group (Holdings) plc (LON:FDM) may be sending bullish signals at the moment, given that almost half of all companies in the United Kingdom have P/E ratios greater than 15x and even P/E's higher than 28x are not unusual. Nonetheless, we'd need to dig a little deeper to determine if there is a rational basis for the reduced P/E.
Recent times have been pleasing for FDM Group (Holdings) as its earnings have risen in spite of the market's earnings going into reverse. One possibility is that the P/E is low because investors think the company's earnings are going to fall away like everyone else's soon. If not, then existing shareholders have reason to be quite optimistic about the future direction of the share price.
Check out our latest analysis for FDM Group (Holdings)

How Is FDM Group (Holdings)'s Growth Trending?
In order to justify its P/E ratio, FDM Group (Holdings) would need to produce sluggish growth that's trailing the market.
If we review the last year of earnings growth, the company posted a terrific increase of 19%. Although, its longer-term performance hasn't been as strong with three-year EPS growth being relatively non-existent overall. So it appears to us that the company has had a mixed result in terms of growing earnings over that time.
Turning to the outlook, the next three years should bring diminished returns, with earnings decreasing 8.3% per annum as estimated by the six analysts watching the company. That's not great when the rest of the market is expected to grow by 12% per year.
In light of this, it's understandable that FDM Group (Holdings)'s P/E would sit below the majority of other companies. However, shrinking earnings are unlikely to lead to a stable P/E over the longer term. There's potential for the P/E to fall to even lower levels if the company doesn't improve its profitability.
The Key Takeaway
We'd say the price-to-earnings ratio's power isn't primarily as a valuation instrument but rather to gauge current investor sentiment and future expectations.
We've established that FDM Group (Holdings) maintains its low P/E on the weakness of its forecast for sliding earnings, as expected. Right now shareholders are accepting the low P/E as they concede future earnings probably won't provide any pleasant surprises. Unless these conditions improve, they will continue to form a barrier for the share price around these levels.
It is also worth noting that we have found 2 warning signs for FDM Group (Holdings) (1 can't be ignored!) that you need to take into consideration.
If P/E ratios interest you, you may wish to see this free collection of other companies with strong earnings growth and low P/E ratios.
New: AI Stock Screener & Alerts
Our new AI Stock Screener scans the market every day to uncover opportunities.
• Dividend Powerhouses (3%+ Yield)
• Undervalued Small Caps with Insider Buying
• High growth Tech and AI Companies
Or build your own from over 50 metrics.
Have feedback on this article? Concerned about the content? Get in touch with us directly. Alternatively, email editorial-team (at) simplywallst.com.
This article by Simply Wall St is general in nature. We provide commentary based on historical data and analyst forecasts only using an unbiased methodology and our articles are not intended to be financial advice. It does not constitute a recommendation to buy or sell any stock, and does not take account of your objectives, or your financial situation. We aim to bring you long-term focused analysis driven by fundamental data. Note that our analysis may not factor in the latest price-sensitive company announcements or qualitative material. Simply Wall St has no position in any stocks mentioned.
About LSE:FDM
FDM Group (Holdings)
Provides information technology (IT) services in the United Kingdom, North America, Europe, the Middle East, Africa, rest of Europe, and the Asia Pacific.
Flawless balance sheet, good value and pays a dividend.
Market Insights
Community Narratives


