
Advertisement
- United Kingdom
- /
- Software
- /
- AIM:OMG
There's Reason For Concern Over Oxford Metrics plc's (LON:OMG) Massive 31% Price Jump
Oxford Metrics plc (LON:OMG) shares have had a really impressive month, gaining 31% after a shaky period beforehand. Unfortunately, the gains of the last month did little to right the losses of the last year with the stock still down 45% over that time.
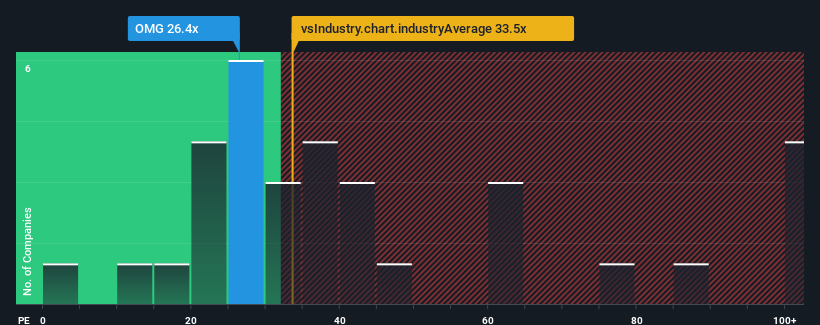
Since its price has surged higher, Oxford Metrics may be sending very bearish signals at the moment with a price-to-earnings (or "P/E") ratio of 26.4x, since almost half of all companies in the United Kingdom have P/E ratios under 16x and even P/E's lower than 9x are not unusual. Nonetheless, we'd need to dig a little deeper to determine if there is a rational basis for the highly elevated P/E.
Oxford Metrics could be doing better as its earnings have been going backwards lately while most other companies have been seeing positive earnings growth. One possibility is that the P/E is high because investors think this poor earnings performance will turn the corner. You'd really hope so, otherwise you're paying a pretty hefty price for no particular reason.
View our latest analysis for Oxford Metrics
What Are Growth Metrics Telling Us About The High P/E?
There's an inherent assumption that a company should far outperform the market for P/E ratios like Oxford Metrics' to be considered reasonable.
Retrospectively, the last year delivered a frustrating 56% decrease to the company's bottom line. The last three years don't look nice either as the company has shrunk EPS by 2.3% in aggregate. Accordingly, shareholders would have felt downbeat about the medium-term rates of earnings growth.
Looking ahead now, EPS is anticipated to slump, contracting by 1.4% during the coming year according to the three analysts following the company. Meanwhile, the broader market is forecast to expand by 18%, which paints a poor picture.
In light of this, it's alarming that Oxford Metrics' P/E sits above the majority of other companies. Apparently many investors in the company reject the analyst cohort's pessimism and aren't willing to let go of their stock at any price. There's a very good chance these shareholders are setting themselves up for future disappointment if the P/E falls to levels more in line with the negative growth outlook.
The Key Takeaway
The strong share price surge has got Oxford Metrics' P/E rushing to great heights as well. Generally, our preference is to limit the use of the price-to-earnings ratio to establishing what the market thinks about the overall health of a company.
We've established that Oxford Metrics currently trades on a much higher than expected P/E for a company whose earnings are forecast to decline. Right now we are increasingly uncomfortable with the high P/E as the predicted future earnings are highly unlikely to support such positive sentiment for long. This places shareholders' investments at significant risk and potential investors in danger of paying an excessive premium.
Having said that, be aware Oxford Metrics is showing 3 warning signs in our investment analysis, and 2 of those make us uncomfortable.
You might be able to find a better investment than Oxford Metrics. If you want a selection of possible candidates, check out this free list of interesting companies that trade on a low P/E (but have proven they can grow earnings).
New: AI Stock Screener & Alerts
Our new AI Stock Screener scans the market every day to uncover opportunities.
• Dividend Powerhouses (3%+ Yield)
• Undervalued Small Caps with Insider Buying
• High growth Tech and AI Companies
Or build your own from over 50 metrics.
Have feedback on this article? Concerned about the content? Get in touch with us directly. Alternatively, email editorial-team (at) simplywallst.com.
This article by Simply Wall St is general in nature. We provide commentary based on historical data and analyst forecasts only using an unbiased methodology and our articles are not intended to be financial advice. It does not constitute a recommendation to buy or sell any stock, and does not take account of your objectives, or your financial situation. We aim to bring you long-term focused analysis driven by fundamental data. Note that our analysis may not factor in the latest price-sensitive company announcements or qualitative material. Simply Wall St has no position in any stocks mentioned.
About AIM:OMG
Oxford Metrics
Operates as a smart sensing and software company in the United Kingdom.
Flawless balance sheet, undervalued and pays a dividend.
Market Insights

Advertisement
Community Narratives
MicroVision will explode future revenue by 380.37% with a vision towards success
Fair Value US$60.00|98.4% undervalued
TH
Community Contributor
The Indispensable Artery for a New North American Economy
Fair Value CA$132.87|1.3% undervalued
TI
Community Contributor