
Advertisement
- United Kingdom
- /
- Software
- /
- AIM:CER
Cerillion (LON:CER) jumps 8.9% this week, though earnings growth is still tracking behind five-year shareholder returns
For many, the main point of investing in the stock market is to achieve spectacular returns. While not every stock performs well, when investors win, they can win big. To wit, the Cerillion Plc (LON:CER) share price has soared 560% over five years. And this is just one example of the epic gains achieved by some long term investors. In more good news, the share price has risen 38% in thirty days. Anyone who held for that rewarding ride would probably be keen to talk about it.
Since the stock has added UK£44m to its market cap in the past week alone, let's see if underlying performance has been driving long-term returns.
Our free stock report includes 1 warning sign investors should be aware of before investing in Cerillion. Read for free now.While the efficient markets hypothesis continues to be taught by some, it has been proven that markets are over-reactive dynamic systems, and investors are not always rational. One way to examine how market sentiment has changed over time is to look at the interaction between a company's share price and its earnings per share (EPS).
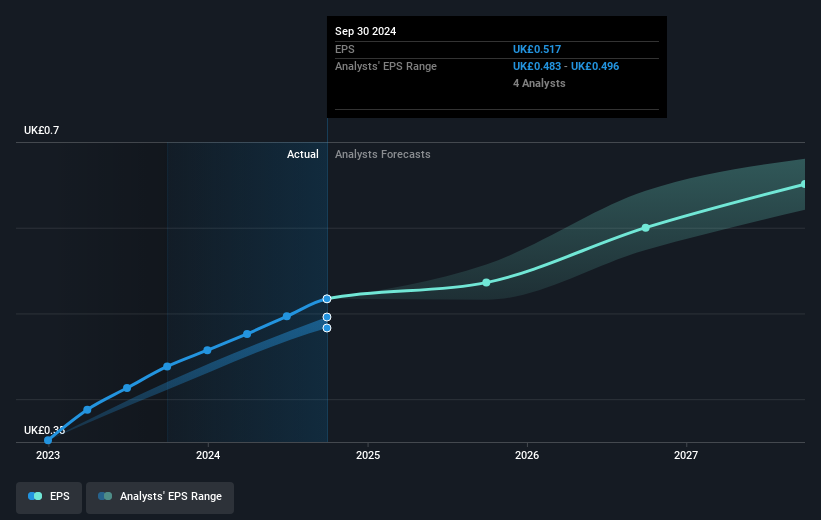
During five years of share price growth, Cerillion achieved compound earnings per share (EPS) growth of 46% per year. This EPS growth is remarkably close to the 46% average annual increase in the share price. This indicates that investor sentiment towards the company has not changed a great deal. Indeed, it would appear the share price is reacting to the EPS.
You can see below how EPS has changed over time (discover the exact values by clicking on the image).
It is of course excellent to see how Cerillion has grown profits over the years, but the future is more important for shareholders. This free interactive report on Cerillion's balance sheet strength is a great place to start, if you want to investigate the stock further.
What About Dividends?
When looking at investment returns, it is important to consider the difference between total shareholder return (TSR) and share price return. The TSR is a return calculation that accounts for the value of cash dividends (assuming that any dividend received was reinvested) and the calculated value of any discounted capital raisings and spin-offs. It's fair to say that the TSR gives a more complete picture for stocks that pay a dividend. As it happens, Cerillion's TSR for the last 5 years was 593%, which exceeds the share price return mentioned earlier. The dividends paid by the company have thusly boosted the total shareholder return.
A Different Perspective
We're pleased to report that Cerillion shareholders have received a total shareholder return of 22% over one year. And that does include the dividend. However, the TSR over five years, coming in at 47% per year, is even more impressive. Potential buyers might understandably feel they've missed the opportunity, but it's always possible business is still firing on all cylinders. It's always interesting to track share price performance over the longer term. But to understand Cerillion better, we need to consider many other factors. Case in point: We've spotted 1 warning sign for Cerillion you should be aware of.
Of course Cerillion may not be the best stock to buy. So you may wish to see this free collection of growth stocks.
Please note, the market returns quoted in this article reflect the market weighted average returns of stocks that currently trade on British exchanges.
New: AI Stock Screener & Alerts
Our new AI Stock Screener scans the market every day to uncover opportunities.
• Dividend Powerhouses (3%+ Yield)
• Undervalued Small Caps with Insider Buying
• High growth Tech and AI Companies
Or build your own from over 50 metrics.
Have feedback on this article? Concerned about the content? Get in touch with us directly. Alternatively, email editorial-team (at) simplywallst.com.
This article by Simply Wall St is general in nature. We provide commentary based on historical data and analyst forecasts only using an unbiased methodology and our articles are not intended to be financial advice. It does not constitute a recommendation to buy or sell any stock, and does not take account of your objectives, or your financial situation. We aim to bring you long-term focused analysis driven by fundamental data. Note that our analysis may not factor in the latest price-sensitive company announcements or qualitative material. Simply Wall St has no position in any stocks mentioned.
About AIM:CER
Cerillion
Provides software for billing, charging, and customer relationship management (CRM) to the telecommunications sector in the United Kingdom, Europe, the Middle East, the Americas, and the Asia Pacific.
Flawless balance sheet and good value.
Similar Companies
Market Insights

Advertisement
Community Narratives
The company that turned a verb into a global necessity and basically runs the modern internet, digital ads, smartphones, maps, and AI.
Fair Value US$300.00|6.3% undervalued
OS
Community Contributor
Flowers Foods Pays A Fair Price For Health
Fair Value US$16.12|26.0% undervalued
NV
Community Contributor
TMX Group will thrive with 33.3% profit margin and enduring market moat
Fair Value CA$49.90|3.7% overvalued
LI
Community Contributor