Stock Analysis
- United Kingdom
- /
- Media
- /
- AIM:YOU
YouGov plc's (LON:YOU) Recent Stock Performance Looks Decent- Can Strong Fundamentals Be the Reason?


YouGov's (LON:YOU) stock up by 3.5% over the past week. Given that the market rewards strong financials in the long-term, we wonder if that is the case in this instance. In this article, we decided to focus on YouGov's ROE.
Return on equity or ROE is an important factor to be considered by a shareholder because it tells them how effectively their capital is being reinvested. In short, ROE shows the profit each dollar generates with respect to its shareholder investments.
See our latest analysis for YouGov
How Is ROE Calculated?
The formula for ROE is:
Return on Equity = Net Profit (from continuing operations) ÷ Shareholders' Equity
So, based on the above formula, the ROE for YouGov is:
18% = UK£35m ÷ UK£196m (Based on the trailing twelve months to July 2023).
The 'return' is the yearly profit. That means that for every £1 worth of shareholders' equity, the company generated £0.18 in profit.
What Is The Relationship Between ROE And Earnings Growth?
Thus far, we have learned that ROE measures how efficiently a company is generating its profits. Depending on how much of these profits the company reinvests or "retains", and how effectively it does so, we are then able to assess a company’s earnings growth potential. Assuming everything else remains unchanged, the higher the ROE and profit retention, the higher the growth rate of a company compared to companies that don't necessarily bear these characteristics.
YouGov's Earnings Growth And 18% ROE
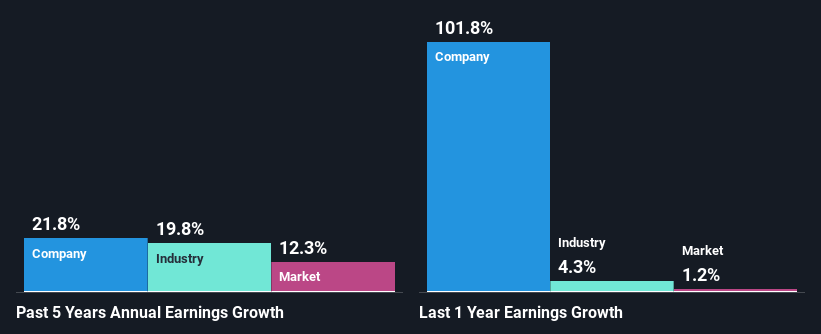
To start with, YouGov's ROE looks acceptable. On comparing with the average industry ROE of 11% the company's ROE looks pretty remarkable. Probably as a result of this, YouGov was able to see an impressive net income growth of 22% over the last five years. However, there could also be other causes behind this growth. Such as - high earnings retention or an efficient management in place.
As a next step, we compared YouGov's net income growth with the industry and found that the company has a similar growth figure when compared with the industry average growth rate of 20% in the same period.
The basis for attaching value to a company is, to a great extent, tied to its earnings growth. It’s important for an investor to know whether the market has priced in the company's expected earnings growth (or decline). Doing so will help them establish if the stock's future looks promising or ominous. What is YOU worth today? The intrinsic value infographic in our free research report helps visualize whether YOU is currently mispriced by the market.
Is YouGov Efficiently Re-investing Its Profits?
The three-year median payout ratio for YouGov is 49%, which is moderately low. The company is retaining the remaining 51%. This suggests that its dividend is well covered, and given the high growth we discussed above, it looks like YouGov is reinvesting its earnings efficiently.
Additionally, YouGov has paid dividends over a period of at least ten years which means that the company is pretty serious about sharing its profits with shareholders. Our latest analyst data shows that the future payout ratio of the company is expected to drop to 18% over the next three years. As a result, the expected drop in YouGov's payout ratio explains the anticipated rise in the company's future ROE to 27%, over the same period.
Summary
In total, we are pretty happy with YouGov's performance. Particularly, we like that the company is reinvesting heavily into its business, and at a high rate of return. Unsurprisingly, this has led to an impressive earnings growth. On studying current analyst estimates, we found that analysts expect the company to continue its recent growth streak. To know more about the latest analysts predictions for the company, check out this visualization of analyst forecasts for the company.
Valuation is complex, but we're helping make it simple.
Find out whether YouGov is potentially over or undervalued by checking out our comprehensive analysis, which includes fair value estimates, risks and warnings, dividends, insider transactions and financial health.
View the Free AnalysisHave feedback on this article? Concerned about the content? Get in touch with us directly. Alternatively, email editorial-team (at) simplywallst.com.
This article by Simply Wall St is general in nature. We provide commentary based on historical data and analyst forecasts only using an unbiased methodology and our articles are not intended to be financial advice. It does not constitute a recommendation to buy or sell any stock, and does not take account of your objectives, or your financial situation. We aim to bring you long-term focused analysis driven by fundamental data. Note that our analysis may not factor in the latest price-sensitive company announcements or qualitative material. Simply Wall St has no position in any stocks mentioned.
About AIM:YOU
YouGov
Provides online market research services in the United Kingdom, the United States, the Middle East, Mainland Europe, and the Asia Pacific.
High growth potential, good value and pays a dividend.
