
Advertisement
Legendary fund manager Li Lu (who Charlie Munger backed) once said, 'The biggest investment risk is not the volatility of prices, but whether you will suffer a permanent loss of capital.' So it might be obvious that you need to consider debt, when you think about how risky any given stock is, because too much debt can sink a company. Importantly, The Mission Group plc (LON:TMG) does carry debt. But should shareholders be worried about its use of debt?
Why Does Debt Bring Risk?
Debt is a tool to help businesses grow, but if a business is incapable of paying off its lenders, then it exists at their mercy. Part and parcel of capitalism is the process of 'creative destruction' where failed businesses are mercilessly liquidated by their bankers. However, a more frequent (but still costly) occurrence is where a company must issue shares at bargain-basement prices, permanently diluting shareholders, just to shore up its balance sheet. Of course, plenty of companies use debt to fund growth, without any negative consequences. When we think about a company's use of debt, we first look at cash and debt together.
Check out our latest analysis for Mission Group
What Is Mission Group's Debt?
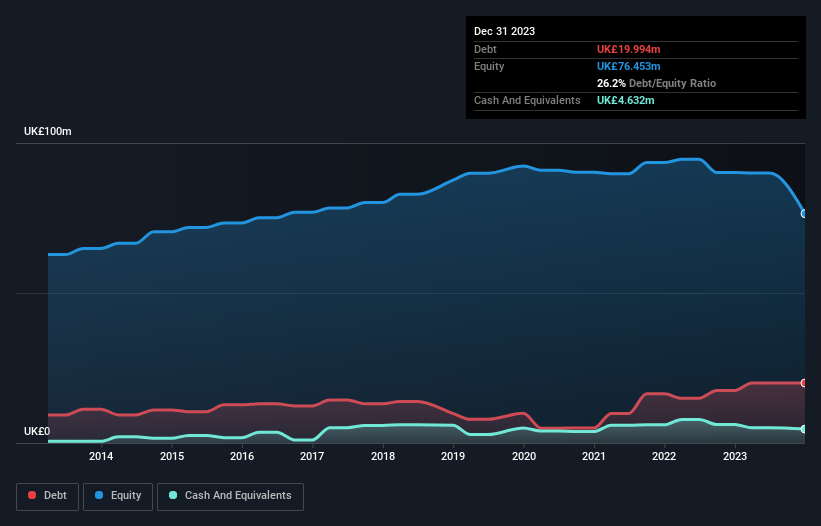
You can click the graphic below for the historical numbers, but it shows that as of December 2023 Mission Group had UK£20.0m of debt, an increase on UK£17.5m, over one year. However, it does have UK£4.63m in cash offsetting this, leading to net debt of about UK£15.4m.
How Healthy Is Mission Group's Balance Sheet?
Zooming in on the latest balance sheet data, we can see that Mission Group had liabilities of UK£47.2m due within 12 months and liabilities of UK£40.0m due beyond that. Offsetting this, it had UK£4.63m in cash and UK£45.1m in receivables that were due within 12 months. So its liabilities total UK£37.4m more than the combination of its cash and short-term receivables.
The deficiency here weighs heavily on the UK£19.2m company itself, as if a child were struggling under the weight of an enormous back-pack full of books, his sports gear, and a trumpet. So we definitely think shareholders need to watch this one closely. At the end of the day, Mission Group would probably need a major re-capitalization if its creditors were to demand repayment.
We measure a company's debt load relative to its earnings power by looking at its net debt divided by its earnings before interest, tax, depreciation, and amortization (EBITDA) and by calculating how easily its earnings before interest and tax (EBIT) cover its interest expense (interest cover). Thus we consider debt relative to earnings both with and without depreciation and amortization expenses.
Given net debt is only 0.77 times EBITDA, it is initially surprising to see that Mission Group's EBIT has low interest coverage of 1.9 times. So one way or the other, it's clear the debt levels are not trivial. Shareholders should be aware that Mission Group's EBIT was down 37% last year. If that earnings trend continues then paying off its debt will be about as easy as herding cats on to a roller coaster. There's no doubt that we learn most about debt from the balance sheet. But ultimately the future profitability of the business will decide if Mission Group can strengthen its balance sheet over time. So if you want to see what the professionals think, you might find this free report on analyst profit forecasts to be interesting.
But our final consideration is also important, because a company cannot pay debt with paper profits; it needs cold hard cash. So we always check how much of that EBIT is translated into free cash flow. Looking at the most recent three years, Mission Group recorded free cash flow of 42% of its EBIT, which is weaker than we'd expect. That weak cash conversion makes it more difficult to handle indebtedness.
Our View
On the face of it, Mission Group's EBIT growth rate left us tentative about the stock, and its level of total liabilities was no more enticing than the one empty restaurant on the busiest night of the year. But at least it's pretty decent at managing its debt, based on its EBITDA,; that's encouraging. After considering the datapoints discussed, we think Mission Group has too much debt. While some investors love that sort of risky play, it's certainly not our cup of tea. When analysing debt levels, the balance sheet is the obvious place to start. However, not all investment risk resides within the balance sheet - far from it. For example - Mission Group has 2 warning signs we think you should be aware of.
If you're interested in investing in businesses that can grow profits without the burden of debt, then check out this free list of growing businesses that have net cash on the balance sheet.
New: Manage All Your Stock Portfolios in One Place
We've created the ultimate portfolio companion for stock investors, and it's free.
• Connect an unlimited number of Portfolios and see your total in one currency
• Be alerted to new Warning Signs or Risks via email or mobile
• Track the Fair Value of your stocks
Have feedback on this article? Concerned about the content? Get in touch with us directly. Alternatively, email editorial-team (at) simplywallst.com.
This article by Simply Wall St is general in nature. We provide commentary based on historical data and analyst forecasts only using an unbiased methodology and our articles are not intended to be financial advice. It does not constitute a recommendation to buy or sell any stock, and does not take account of your objectives, or your financial situation. We aim to bring you long-term focused analysis driven by fundamental data. Note that our analysis may not factor in the latest price-sensitive company announcements or qualitative material. Simply Wall St has no position in any stocks mentioned.
About AIM:TMG
Mission Group
Operates as a collective of creative and martech agencies company in the United Kingdom, the United States, Asia, and rest of Europe.
Good value with adequate balance sheet.
Market Insights

Advertisement
Community Narratives
The company that turned a verb into a global necessity and basically runs the modern internet, digital ads, smartphones, maps, and AI.
Fair Value US$300.00|6.2% undervalued
OS
Community Contributor
Flowers Foods Pays A Fair Price For Health
Fair Value US$16.12|25.1% undervalued
NV
Community Contributor
TMX Group will thrive with 33.3% profit margin and enduring market moat
Fair Value CA$49.90|0.04% overvalued
LI
Community Contributor