Stock Analysis
- United Kingdom
- /
- Media
- /
- AIM:PEBB
Declining Stock and Decent Financials: Is The Market Wrong About The Pebble Group plc (LON:PEBB)?


Pebble Group (LON:PEBB) has had a rough three months with its share price down 14%. But if you pay close attention, you might find that its key financial indicators look quite decent, which could mean that the stock could potentially rise in the long-term given how markets usually reward more resilient long-term fundamentals. Particularly, we will be paying attention to Pebble Group's ROE today.
Return on equity or ROE is an important factor to be considered by a shareholder because it tells them how effectively their capital is being reinvested. Put another way, it reveals the company's success at turning shareholder investments into profits.
View our latest analysis for Pebble Group
How Is ROE Calculated?
The formula for return on equity is:
Return on Equity = Net Profit (from continuing operations) ÷ Shareholders' Equity
So, based on the above formula, the ROE for Pebble Group is:
8.9% = UK£7.6m ÷ UK£86m (Based on the trailing twelve months to December 2022).
The 'return' is the yearly profit. That means that for every £1 worth of shareholders' equity, the company generated £0.09 in profit.
What Has ROE Got To Do With Earnings Growth?
Thus far, we have learned that ROE measures how efficiently a company is generating its profits. We now need to evaluate how much profit the company reinvests or "retains" for future growth which then gives us an idea about the growth potential of the company. Generally speaking, other things being equal, firms with a high return on equity and profit retention, have a higher growth rate than firms that don’t share these attributes.
A Side By Side comparison of Pebble Group's Earnings Growth And 8.9% ROE
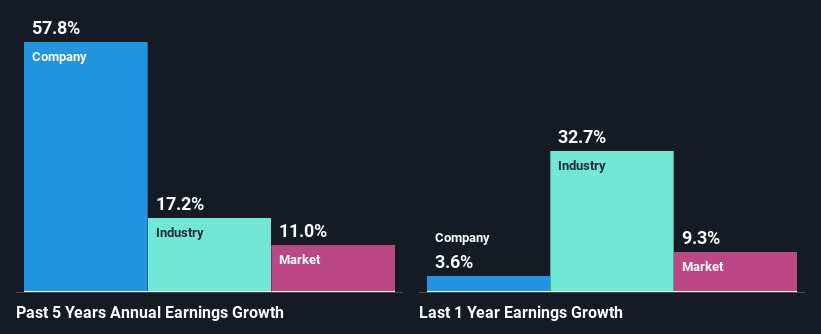
When you first look at it, Pebble Group's ROE doesn't look that attractive. However, given that the company's ROE is similar to the average industry ROE of 8.9%, we may spare it some thought. Moreover, we are quite pleased to see that Pebble Group's net income grew significantly at a rate of 58% over the last five years. Given the slightly low ROE, it is likely that there could be some other aspects that are driving this growth. For example, it is possible that the company's management has made some good strategic decisions, or that the company has a low payout ratio.
Next, on comparing with the industry net income growth, we found that Pebble Group's growth is quite high when compared to the industry average growth of 17% in the same period, which is great to see.
The basis for attaching value to a company is, to a great extent, tied to its earnings growth. What investors need to determine next is if the expected earnings growth, or the lack of it, is already built into the share price. By doing so, they will have an idea if the stock is headed into clear blue waters or if swampy waters await. Has the market priced in the future outlook for PEBB? You can find out in our latest intrinsic value infographic research report.
Is Pebble Group Using Its Retained Earnings Effectively?
Pebble Group has a really low three-year median payout ratio of 13%, meaning that it has the remaining 87% left over to reinvest into its business. This suggests that the management is reinvesting most of the profits to grow the business as evidenced by the growth seen by the company.
Upon studying the latest analysts' consensus data, we found that the company's future payout ratio is expected to rise to 23% over the next three years.
Conclusion
Overall, we feel that Pebble Group certainly does have some positive factors to consider. Despite its low rate of return, the fact that the company reinvests a very high portion of its profits into its business, no doubt contributed to its high earnings growth. With that said, the latest industry analyst forecasts reveal that the company's earnings growth is expected to slow down. To know more about the latest analysts predictions for the company, check out this visualization of analyst forecasts for the company.
Valuation is complex, but we're helping make it simple.
Find out whether Pebble Group is potentially over or undervalued by checking out our comprehensive analysis, which includes fair value estimates, risks and warnings, dividends, insider transactions and financial health.
View the Free AnalysisHave feedback on this article? Concerned about the content? Get in touch with us directly. Alternatively, email editorial-team (at) simplywallst.com.
This article by Simply Wall St is general in nature. We provide commentary based on historical data and analyst forecasts only using an unbiased methodology and our articles are not intended to be financial advice. It does not constitute a recommendation to buy or sell any stock, and does not take account of your objectives, or your financial situation. We aim to bring you long-term focused analysis driven by fundamental data. Note that our analysis may not factor in the latest price-sensitive company announcements or qualitative material. Simply Wall St has no position in any stocks mentioned.
About AIM:PEBB
Pebble Group
Sells digital commerce, products, and related services to the promotional merchandise industry in the United Kingdom, Continental Europe, the United States, and internationally.
Flawless balance sheet second-rate dividend payer.
