- United Kingdom
- /
- Metals and Mining
- /
- LSE:ECOR
Did You Participate In Any Of Anglo Pacific Group's (LON:APF) Fantastic 227% Return ?


When you buy a stock there is always a possibility that it could drop 100%. But on the bright side, if you buy shares in a high quality company at the right price, you can gain well over 100%. One great example is Anglo Pacific Group plc (LON:APF) which saw its share price drive 149% higher over five years. It's also good to see the share price up 31% over the last quarter. But this could be related to the strong market, which is up 14% in the last three months.
See our latest analysis for Anglo Pacific Group
While the efficient markets hypothesis continues to be taught by some, it has been proven that markets are over-reactive dynamic systems, and investors are not always rational. One flawed but reasonable way to assess how sentiment around a company has changed is to compare the earnings per share (EPS) with the share price.
We know that Anglo Pacific Group has been profitable in the past. On the other hand, it reported a trailing twelve months loss, suggesting it isn't reliably profitable. So it might be better to look at other metrics to try to understand the share price.
We note that the dividend is higher than it was previously - always nice to see. Maybe dividend investors have helped support the share price. The revenue growth of about 34% per year might also encourage buyers.
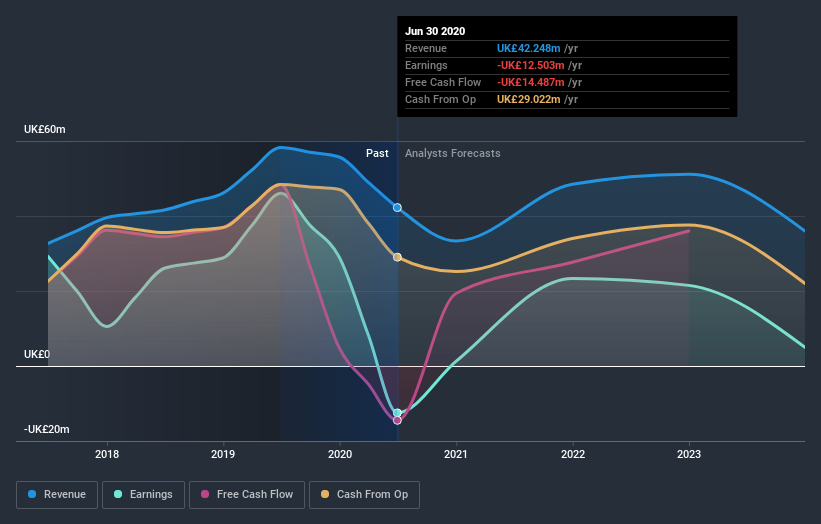
The company's revenue and earnings (over time) are depicted in the image below (click to see the exact numbers).
We consider it positive that insiders have made significant purchases in the last year. Even so, future earnings will be far more important to whether current shareholders make money. If you are thinking of buying or selling Anglo Pacific Group stock, you should check out this free report showing analyst profit forecasts.
What About Dividends?
It is important to consider the total shareholder return, as well as the share price return, for any given stock. The TSR incorporates the value of any spin-offs or discounted capital raisings, along with any dividends, based on the assumption that the dividends are reinvested. It's fair to say that the TSR gives a more complete picture for stocks that pay a dividend. In the case of Anglo Pacific Group, it has a TSR of 227% for the last 5 years. That exceeds its share price return that we previously mentioned. And there's no prize for guessing that the dividend payments largely explain the divergence!
A Different Perspective
While the broader market lost about 1.9% in the twelve months, Anglo Pacific Group shareholders did even worse, losing 20% (even including dividends). However, it could simply be that the share price has been impacted by broader market jitters. It might be worth keeping an eye on the fundamentals, in case there's a good opportunity. Longer term investors wouldn't be so upset, since they would have made 27%, each year, over five years. It could be that the recent sell-off is an opportunity, so it may be worth checking the fundamental data for signs of a long term growth trend. It's always interesting to track share price performance over the longer term. But to understand Anglo Pacific Group better, we need to consider many other factors. Take risks, for example - Anglo Pacific Group has 2 warning signs we think you should be aware of.
There are plenty of other companies that have insiders buying up shares. You probably do not want to miss this free list of growing companies that insiders are buying.
Please note, the market returns quoted in this article reflect the market weighted average returns of stocks that currently trade on GB exchanges.
If you decide to trade Anglo Pacific Group, use the lowest-cost* platform that is rated #1 Overall by Barron’s, Interactive Brokers. Trade stocks, options, futures, forex, bonds and funds on 135 markets, all from a single integrated account. Promoted
Valuation is complex, but we're here to simplify it.
Discover if Ecora Resources might be undervalued or overvalued with our detailed analysis, featuring fair value estimates, potential risks, dividends, insider trades, and its financial condition.
Access Free AnalysisThis article by Simply Wall St is general in nature. It does not constitute a recommendation to buy or sell any stock, and does not take account of your objectives, or your financial situation. We aim to bring you long-term focused analysis driven by fundamental data. Note that our analysis may not factor in the latest price-sensitive company announcements or qualitative material. Simply Wall St has no position in any stocks mentioned.
*Interactive Brokers Rated Lowest Cost Broker by StockBrokers.com Annual Online Review 2020
Have feedback on this article? Concerned about the content? Get in touch with us directly. Alternatively, email editorial-team (at) simplywallst.com.
About LSE:ECOR
Ecora Resources
Operates as a natural resource royalty and streaming company in Australia, North and South America, Europe, and internationally.
Very undervalued with adequate balance sheet.

