- United Kingdom
- /
- Metals and Mining
- /
- AIM:SML
What Do The Returns At Strategic Minerals (LON:SML) Mean Going Forward?

If you're not sure where to start when looking for the next multi-bagger, there are a few key trends you should keep an eye out for. Amongst other things, we'll want to see two things; firstly, a growing return on capital employed (ROCE) and secondly, an expansion in the company's amount of capital employed. If you see this, it typically means it's a company with a great business model and plenty of profitable reinvestment opportunities. Speaking of which, we noticed some great changes in Strategic Minerals' (LON:SML) returns on capital, so let's have a look.
Return On Capital Employed (ROCE): What is it?
Just to clarify if you're unsure, ROCE is a metric for evaluating how much pre-tax income (in percentage terms) a company earns on the capital invested in its business. The formula for this calculation on Strategic Minerals is:
Return on Capital Employed = Earnings Before Interest and Tax (EBIT) ÷ (Total Assets - Current Liabilities)
0.044 = US$536k ÷ (US$13m - US$851k) (Based on the trailing twelve months to June 2020).
Therefore, Strategic Minerals has an ROCE of 4.4%. In absolute terms, that's a low return and it also under-performs the Metals and Mining industry average of 12%.
Check out our latest analysis for Strategic Minerals
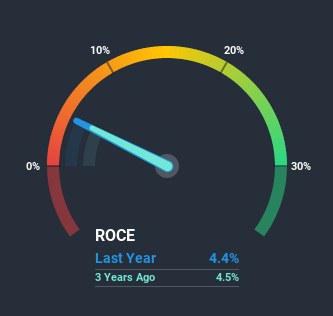
Historical performance is a great place to start when researching a stock so above you can see the gauge for Strategic Minerals' ROCE against it's prior returns. If you're interested in investigating Strategic Minerals' past further, check out this free graph of past earnings, revenue and cash flow.
What Does the ROCE Trend For Strategic Minerals Tell Us?
The fact that Strategic Minerals is now generating some pre-tax profits from its prior investments is very encouraging. About five years ago the company was generating losses but things have turned around because it's now earning 4.4% on its capital. Not only that, but the company is utilizing 423% more capital than before, but that's to be expected from a company trying to break into profitability. This can indicate that there's plenty of opportunities to invest capital internally and at ever higher rates, both common traits of a multi-bagger.
In another part of our analysis, we noticed that the company's ratio of current liabilities to total assets decreased to 6.6%, which broadly means the business is relying less on its suppliers or short-term creditors to fund its operations. Therefore we can rest assured that the growth in ROCE is a result of the business' fundamental improvements, rather than a cooking class featuring this company's books.
The Bottom Line On Strategic Minerals' ROCE
In summary, it's great to see that Strategic Minerals has managed to break into profitability and is continuing to reinvest in its business. And with the stock having performed exceptionally well over the last five years, these patterns are being accounted for by investors. With that being said, we still think the promising fundamentals mean the company deserves some further due diligence.
On a separate note, we've found 4 warning signs for Strategic Minerals you'll probably want to know about.
If you want to search for solid companies with great earnings, check out this free list of companies with good balance sheets and impressive returns on equity.
If you’re looking to trade Strategic Minerals, open an account with the lowest-cost* platform trusted by professionals, Interactive Brokers. Their clients from over 200 countries and territories trade stocks, options, futures, forex, bonds and funds worldwide from a single integrated account. Promoted
The New Payments ETF Is Live on NASDAQ:
Money is moving to real-time rails, and a newly listed ETF now gives investors direct exposure. Fast settlement. Institutional custody. Simple access.
Explore how this launch could reshape portfolios
Sponsored ContentNew: Manage All Your Stock Portfolios in One Place
We've created the ultimate portfolio companion for stock investors, and it's free.
• Connect an unlimited number of Portfolios and see your total in one currency
• Be alerted to new Warning Signs or Risks via email or mobile
• Track the Fair Value of your stocks
This article by Simply Wall St is general in nature. It does not constitute a recommendation to buy or sell any stock, and does not take account of your objectives, or your financial situation. We aim to bring you long-term focused analysis driven by fundamental data. Note that our analysis may not factor in the latest price-sensitive company announcements or qualitative material. Simply Wall St has no position in any stocks mentioned.
*Interactive Brokers Rated Lowest Cost Broker by StockBrokers.com Annual Online Review 2020
Have feedback on this article? Concerned about the content? Get in touch with us directly. Alternatively, email editorial-team (at) simplywallst.com.
About AIM:SML
Strategic Minerals
Engages in the exploration, development, and operation of mining projects.
Excellent balance sheet with slight risk.
Market Insights

Weekly Picks

Early mover in a fast growing industry. Likely to experience share price volatility as they scale


A case for CA$31.80 (undiluted), aka 8,616% upside from CA$0.37 (an 86 bagger!).


Moderation and Stabilisation: HOLD: Fair Price based on a 4-year Cycle is $12.08
Recently Updated Narratives

Automotive Electronics Manufacturer Consistent and Stable

Airbnb Stock: Platform Growth in a World of Saturation and Scrutiny

Adobe Stock: AI-Fueled ARR Growth Pushes Guidance Higher, But Cost Pressures Loom
Popular Narratives


Crazy Undervalued 42 Baggers Silver Play (Active & Running Mine)


NVDA: Expanding AI Demand Will Drive Major Data Center Investments Through 2026

The AI Infrastructure Giant Grows Into Its Valuation
Trending Discussion


