
Advertisement
The Directa Plus Plc (LON:DCTA) share price has fared very poorly over the last month, falling by a substantial 39%. For any long-term shareholders, the last month ends a year to forget by locking in a 77% share price decline.
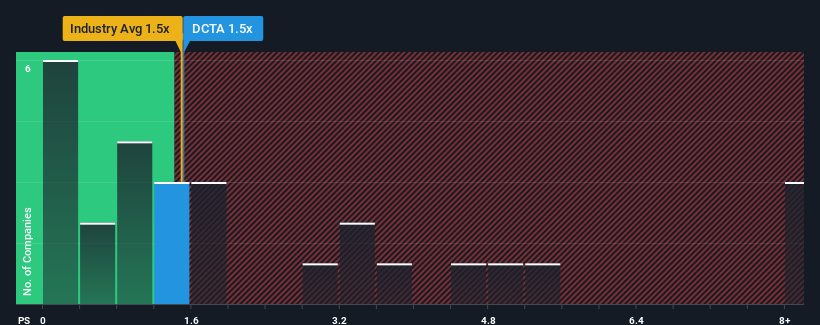
Although its price has dipped substantially, it's still not a stretch to say that Directa Plus' price-to-sales (or "P/S") ratio of 1.5x right now seems quite "middle-of-the-road" compared to the Chemicals industry in the United Kingdom, seeing as it matches the P/S ratio of the wider industry. While this might not raise any eyebrows, if the P/S ratio is not justified investors could be missing out on a potential opportunity or ignoring looming disappointment.
Check out our latest analysis for Directa Plus
How Directa Plus Has Been Performing
Directa Plus has been doing a reasonable job lately as its revenue hasn't declined as much as most other companies. One possibility is that the P/S ratio is moderate because investors think this relatively better revenue performance might be about to evaporate. You'd much rather the company continue improving its revenue if you still believe in the business. But at the very least, you'd be hoping the company doesn't fall back into the pack if your plan is to pick up some stock while it's not in favour.
If you'd like to see what analysts are forecasting going forward, you should check out our free report on Directa Plus.Do Revenue Forecasts Match The P/S Ratio?
The only time you'd be comfortable seeing a P/S like Directa Plus' is when the company's growth is tracking the industry closely.
Retrospectively, the last year delivered a frustrating 6.9% decrease to the company's top line. That put a dampener on the good run it was having over the longer-term as its three-year revenue growth is still a noteworthy 22% in total. Accordingly, while they would have preferred to keep the run going, shareholders would be roughly satisfied with the medium-term rates of revenue growth.
Shifting to the future, estimates from the dual analysts covering the company suggest revenue growth will be highly resilient over the next three years growing by 75% per year. That would be an excellent outcome when the industry is expected to decline by 2.2% each year.
With this in mind, we find it intriguing that Directa Plus' P/S trades in-line with its industry peers. It looks like most investors aren't convinced the company can achieve positive future growth in the face of a shrinking broader industry.
What We Can Learn From Directa Plus' P/S?
With its share price dropping off a cliff, the P/S for Directa Plus looks to be in line with the rest of the Chemicals industry. Using the price-to-sales ratio alone to determine if you should sell your stock isn't sensible, however it can be a practical guide to the company's future prospects.
We've established that Directa Plus currently trades on a lower than expected P/S since its growth forecasts are potentially beating a struggling industry. We assume that investors are attributing some risk to the company's future revenues, keeping it from trading at a higher P/S. One such risk is that the company may not live up to analysts' revenue trajectories in tough industry conditions. At least the risk of a price drop looks to be subdued, but investors seem to think future revenue could see some volatility.
Don't forget that there may be other risks. For instance, we've identified 5 warning signs for Directa Plus (3 are significant) you should be aware of.
Of course, profitable companies with a history of great earnings growth are generally safer bets. So you may wish to see this free collection of other companies that have reasonable P/E ratios and have grown earnings strongly.
New: Manage All Your Stock Portfolios in One Place
We've created the ultimate portfolio companion for stock investors, and it's free.
• Connect an unlimited number of Portfolios and see your total in one currency
• Be alerted to new Warning Signs or Risks via email or mobile
• Track the Fair Value of your stocks
Have feedback on this article? Concerned about the content? Get in touch with us directly. Alternatively, email editorial-team (at) simplywallst.com.
This article by Simply Wall St is general in nature. We provide commentary based on historical data and analyst forecasts only using an unbiased methodology and our articles are not intended to be financial advice. It does not constitute a recommendation to buy or sell any stock, and does not take account of your objectives, or your financial situation. We aim to bring you long-term focused analysis driven by fundamental data. Note that our analysis may not factor in the latest price-sensitive company announcements or qualitative material. Simply Wall St has no position in any stocks mentioned.
About AIM:DCTA
Directa Plus
Manufactures and sells graphene-based products for industrial and commercial applications in Italy, Romania, and internationally.
Slight risk with mediocre balance sheet.
Similar Companies
Market Insights

Advertisement
Community Narratives
MicroVision will explode future revenue by 380.37% with a vision towards success
Fair Value US$60.00|98.4% undervalued
TH
Community Contributor
The Indispensable Artery for a New North American Economy
Fair Value CA$132.87|1.3% undervalued
TI
Community Contributor