
Advertisement
- United Kingdom
- /
- Medical Equipment
- /
- AIM:SPEC
Returns At INSPECS Group (LON:SPEC) Appear To Be Weighed Down
There are a few key trends to look for if we want to identify the next multi-bagger. Firstly, we'll want to see a proven return on capital employed (ROCE) that is increasing, and secondly, an expanding base of capital employed. Ultimately, this demonstrates that it's a business that is reinvesting profits at increasing rates of return. Having said that, from a first glance at INSPECS Group (LON:SPEC) we aren't jumping out of our chairs at how returns are trending, but let's have a deeper look.
What Is Return On Capital Employed (ROCE)?
For those who don't know, ROCE is a measure of a company's yearly pre-tax profit (its return), relative to the capital employed in the business. To calculate this metric for INSPECS Group, this is the formula:
Return on Capital Employed = Earnings Before Interest and Tax (EBIT) ÷ (Total Assets - Current Liabilities)
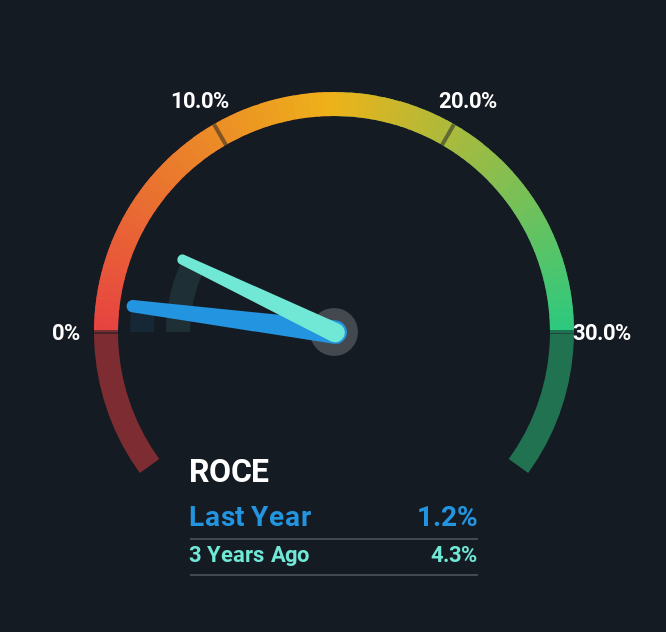
0.012 = UK£1.6m ÷ (UK£204m - UK£69m) (Based on the trailing twelve months to June 2025).
Therefore, INSPECS Group has an ROCE of 1.2%. In absolute terms, that's a low return and it also under-performs the Medical Equipment industry average of 10%.
See our latest analysis for INSPECS Group
While the past is not representative of the future, it can be helpful to know how a company has performed historically, which is why we have this chart above. If you'd like to look at how INSPECS Group has performed in the past in other metrics, you can view this free graph of INSPECS Group's past earnings, revenue and cash flow.
So How Is INSPECS Group's ROCE Trending?
The returns on capital haven't changed much for INSPECS Group in recent years. Over the past five years, ROCE has remained relatively flat at around 1.2% and the business has deployed 112% more capital into its operations. Given the company has increased the amount of capital employed, it appears the investments that have been made simply don't provide a high return on capital.
On another note, while the change in ROCE trend might not scream for attention, it's interesting that the current liabilities have actually gone up over the last five years. This is intriguing because if current liabilities hadn't increased to 34% of total assets, this reported ROCE would probably be less than1.2% because total capital employed would be higher.The 1.2% ROCE could be even lower if current liabilities weren't 34% of total assets, because the the formula would show a larger base of total capital employed. So while current liabilities isn't high right now, keep an eye out in case it increases further, because this can introduce some elements of risk.
What We Can Learn From INSPECS Group's ROCE
In summary, INSPECS Group has simply been reinvesting capital and generating the same low rate of return as before. And investors appear hesitant that the trends will pick up because the stock has fallen 68% in the last five years. In any case, the stock doesn't have these traits of a multi-bagger discussed above, so if that's what you're looking for, we think you'd have more luck elsewhere.
If you want to continue researching INSPECS Group, you might be interested to know about the 2 warning signs that our analysis has discovered.
If you want to search for solid companies with great earnings, check out this free list of companies with good balance sheets and impressive returns on equity.
New: AI Stock Screener & Alerts
Our new AI Stock Screener scans the market every day to uncover opportunities.
• Dividend Powerhouses (3%+ Yield)
• Undervalued Small Caps with Insider Buying
• High growth Tech and AI Companies
Or build your own from over 50 metrics.
Have feedback on this article? Concerned about the content? Get in touch with us directly. Alternatively, email editorial-team (at) simplywallst.com.
This article by Simply Wall St is general in nature. We provide commentary based on historical data and analyst forecasts only using an unbiased methodology and our articles are not intended to be financial advice. It does not constitute a recommendation to buy or sell any stock, and does not take account of your objectives, or your financial situation. We aim to bring you long-term focused analysis driven by fundamental data. Note that our analysis may not factor in the latest price-sensitive company announcements or qualitative material. Simply Wall St has no position in any stocks mentioned.
About AIM:SPEC
INSPECS Group
Designs, produces, sells, markets, and distributes fashion eyewear, lenses, and OEM products in the United Kingdom, Europe, North America, South America, Asia, Africa, and Australia.
Excellent balance sheet and slightly overvalued.
Similar Companies
Market Insights

Advertisement
Community Narratives
The company that turned a verb into a global necessity and basically runs the modern internet, digital ads, smartphones, maps, and AI.
Fair Value US$300.00|5.1% undervalued
OS
Community Contributor
Flowers Foods Pays A Fair Price For Health
Fair Value US$16.12|27.7% undervalued
NV
Community Contributor
TMX Group will thrive with 33.3% profit margin and enduring market moat
Fair Value CA$49.90|0.2% overvalued
LI
Community Contributor
The "Molecular Pencil": Why Beam's Technology is Built to Win
Fair Value US$65.01|64.4% undervalued
DA
Community Contributor