- United Kingdom
- /
- Medical Equipment
- /
- AIM:AMS
What You Can Learn From Advanced Medical Solutions Group plc's (LON:AMS) P/E After Its 25% Share Price Crash

Advanced Medical Solutions Group plc (LON:AMS) shares have had a horrible month, losing 25% after a relatively good period beforehand. Longer-term shareholders would now have taken a real hit with the stock declining 5.0% in the last year.
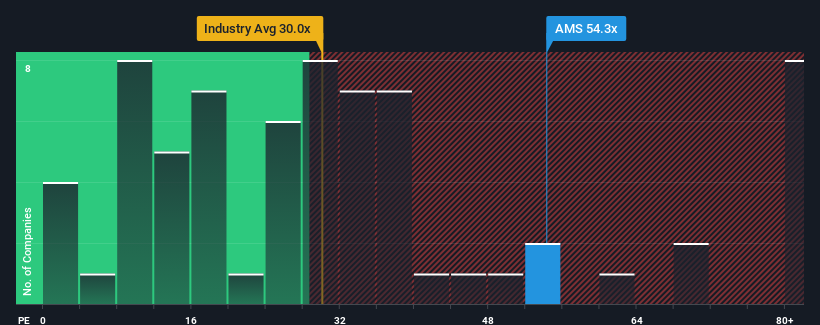
Although its price has dipped substantially, Advanced Medical Solutions Group may still be sending very bearish signals at the moment with a price-to-earnings (or "P/E") ratio of 54.3x, since almost half of all companies in the United Kingdom have P/E ratios under 15x and even P/E's lower than 9x are not unusual. Nonetheless, we'd need to dig a little deeper to determine if there is a rational basis for the highly elevated P/E.
While the market has experienced earnings growth lately, Advanced Medical Solutions Group's earnings have gone into reverse gear, which is not great. One possibility is that the P/E is high because investors think this poor earnings performance will turn the corner. You'd really hope so, otherwise you're paying a pretty hefty price for no particular reason.
Check out our latest analysis for Advanced Medical Solutions Group
What Are Growth Metrics Telling Us About The High P/E?
The only time you'd be truly comfortable seeing a P/E as steep as Advanced Medical Solutions Group's is when the company's growth is on track to outshine the market decidedly.
If we review the last year of earnings, dishearteningly the company's profits fell to the tune of 55%. The last three years don't look nice either as the company has shrunk EPS by 60% in aggregate. Therefore, it's fair to say the earnings growth recently has been undesirable for the company.
Shifting to the future, estimates from the eight analysts covering the company suggest earnings should grow by 54% per year over the next three years. With the market only predicted to deliver 15% per annum, the company is positioned for a stronger earnings result.
With this information, we can see why Advanced Medical Solutions Group is trading at such a high P/E compared to the market. It seems most investors are expecting this strong future growth and are willing to pay more for the stock.
What We Can Learn From Advanced Medical Solutions Group's P/E?
A significant share price dive has done very little to deflate Advanced Medical Solutions Group's very lofty P/E. Generally, our preference is to limit the use of the price-to-earnings ratio to establishing what the market thinks about the overall health of a company.
We've established that Advanced Medical Solutions Group maintains its high P/E on the strength of its forecast growth being higher than the wider market, as expected. At this stage investors feel the potential for a deterioration in earnings isn't great enough to justify a lower P/E ratio. Unless these conditions change, they will continue to provide strong support to the share price.
You should always think about risks. Case in point, we've spotted 3 warning signs for Advanced Medical Solutions Group you should be aware of.
If you're unsure about the strength of Advanced Medical Solutions Group's business, why not explore our interactive list of stocks with solid business fundamentals for some other companies you may have missed.
Mobile Infrastructure for Defense and Disaster
The next wave in robotics isn't humanoid. Its fully autonomous towers delivering 5G, ISR, and radar in under 30 minutes, anywhere.
Get the investor briefing before the next round of contracts
Sponsored On Behalf of CiTechNew: Manage All Your Stock Portfolios in One Place
We've created the ultimate portfolio companion for stock investors, and it's free.
• Connect an unlimited number of Portfolios and see your total in one currency
• Be alerted to new Warning Signs or Risks via email or mobile
• Track the Fair Value of your stocks
Have feedback on this article? Concerned about the content? Get in touch with us directly. Alternatively, email editorial-team (at) simplywallst.com.
This article by Simply Wall St is general in nature. We provide commentary based on historical data and analyst forecasts only using an unbiased methodology and our articles are not intended to be financial advice. It does not constitute a recommendation to buy or sell any stock, and does not take account of your objectives, or your financial situation. We aim to bring you long-term focused analysis driven by fundamental data. Note that our analysis may not factor in the latest price-sensitive company announcements or qualitative material. Simply Wall St has no position in any stocks mentioned.
About AIM:AMS
Advanced Medical Solutions Group
Develops, manufactures, and distributes products for the surgical, woundcare, and wound-closure markets in the United Kingdom, Germany, rest of Europe, the United States, and internationally.
Reasonable growth potential with adequate balance sheet.
Similar Companies
Market Insights

Weekly Picks

Early mover in a fast growing industry. Likely to experience share price volatility as they scale


A case for CA$31.80 (undiluted), aka 8,616% upside from CA$0.37 (an 86 bagger!).


Moderation and Stabilisation: HOLD: Fair Price based on a 4-year Cycle is $12.08
Recently Updated Narratives

Automotive Electronics Manufacturer Consistent and Stable

Airbnb Stock: Platform Growth in a World of Saturation and Scrutiny

Adobe Stock: AI-Fueled ARR Growth Pushes Guidance Higher, But Cost Pressures Loom
Popular Narratives


Crazy Undervalued 42 Baggers Silver Play (Active & Running Mine)


NVDA: Expanding AI Demand Will Drive Major Data Center Investments Through 2026

The AI Infrastructure Giant Grows Into Its Valuation
Trending Discussion


