
Advertisement
Did you know there are some financial metrics that can provide clues of a potential multi-bagger? One common approach is to try and find a company with returns on capital employed (ROCE) that are increasing, in conjunction with a growing amount of capital employed. Put simply, these types of businesses are compounding machines, meaning they are continually reinvesting their earnings at ever-higher rates of return. Although, when we looked at C&C Group (LON:CCR), it didn't seem to tick all of these boxes.
Understanding Return On Capital Employed (ROCE)
For those who don't know, ROCE is a measure of a company's yearly pre-tax profit (its return), relative to the capital employed in the business. The formula for this calculation on C&C Group is:
Return on Capital Employed = Earnings Before Interest and Tax (EBIT) ÷ (Total Assets - Current Liabilities)
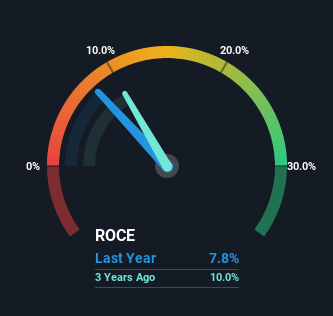
0.078 = €84m ÷ (€1.6b - €487m) (Based on the trailing twelve months to August 2022).
Thus, C&C Group has an ROCE of 7.8%. In absolute terms, that's a low return and it also under-performs the Beverage industry average of 12%.
View our latest analysis for C&C Group
Above you can see how the current ROCE for C&C Group compares to its prior returns on capital, but there's only so much you can tell from the past. If you'd like to see what analysts are forecasting going forward, you should check out our free report for C&C Group.
SWOT Analysis for C&C Group
Strength
- Debt is not viewed as a risk.
Weakness
- No major weaknesses identified for CCR.
Opportunity
- Trading below our estimate of fair value by more than 20%.
Threat
- Annual revenue is forecast to grow slower than the British market.
What The Trend Of ROCE Can Tell Us
Over the past five years, C&C Group's ROCE and capital employed have both remained mostly flat. This tells us the company isn't reinvesting in itself, so it's plausible that it's past the growth phase. So don't be surprised if C&C Group doesn't end up being a multi-bagger in a few years time. This probably explains why C&C Group is paying out 36% of its income to shareholders in the form of dividends. Unless businesses have highly compelling growth opportunities, they'll typically return some money to shareholders.
Another point to note, we noticed the company has increased current liabilities over the last five years. This is intriguing because if current liabilities hadn't increased to 31% of total assets, this reported ROCE would probably be less than7.8% because total capital employed would be higher.The 7.8% ROCE could be even lower if current liabilities weren't 31% of total assets, because the the formula would show a larger base of total capital employed. With that in mind, just be wary if this ratio increases in the future, because if it gets particularly high, this brings with it some new elements of risk.
What We Can Learn From C&C Group's ROCE
In a nutshell, C&C Group has been trudging along with the same returns from the same amount of capital over the last five years. Since the stock has declined 22% over the last three years, investors may not be too optimistic on this trend improving either. In any case, the stock doesn't have these traits of a multi-bagger discussed above, so if that's what you're looking for, we think you'd have more luck elsewhere.
If you're still interested in C&C Group it's worth checking out our FREE intrinsic value approximation to see if it's trading at an attractive price in other respects.
If you want to search for solid companies with great earnings, check out this free list of companies with good balance sheets and impressive returns on equity.
New: AI Stock Screener & Alerts
Our new AI Stock Screener scans the market every day to uncover opportunities.
• Dividend Powerhouses (3%+ Yield)
• Undervalued Small Caps with Insider Buying
• High growth Tech and AI Companies
Or build your own from over 50 metrics.
Have feedback on this article? Concerned about the content? Get in touch with us directly. Alternatively, email editorial-team (at) simplywallst.com.
This article by Simply Wall St is general in nature. We provide commentary based on historical data and analyst forecasts only using an unbiased methodology and our articles are not intended to be financial advice. It does not constitute a recommendation to buy or sell any stock, and does not take account of your objectives, or your financial situation. We aim to bring you long-term focused analysis driven by fundamental data. Note that our analysis may not factor in the latest price-sensitive company announcements or qualitative material. Simply Wall St has no position in any stocks mentioned.
About LSE:CCR
C&C Group
Manufactures, markets, and distributes beer, cider, wine, spirits, and soft drinks in the United Kingdom, the Republic of Ireland, Great Britain, and internationally.
Flawless balance sheet with moderate growth potential.
Similar Companies
Market Insights

Advertisement
Community Narratives
MicroVision will explode future revenue by 380.37% with a vision towards success
Fair Value US$60.00|98.4% undervalued
TH
Community Contributor
The Indispensable Artery for a New North American Economy
Fair Value CA$132.87|1.3% undervalued
TI
Community Contributor