
Advertisement
David Iben put it well when he said, 'Volatility is not a risk we care about. What we care about is avoiding the permanent loss of capital.' It's only natural to consider a company's balance sheet when you examine how risky it is, since debt is often involved when a business collapses. Importantly, Tekmar Group plc (LON:TGP) does carry debt. But the real question is whether this debt is making the company risky.
When Is Debt A Problem?
Generally speaking, debt only becomes a real problem when a company can't easily pay it off, either by raising capital or with its own cash flow. If things get really bad, the lenders can take control of the business. However, a more usual (but still expensive) situation is where a company must dilute shareholders at a cheap share price simply to get debt under control. Of course, the upside of debt is that it often represents cheap capital, especially when it replaces dilution in a company with the ability to reinvest at high rates of return. The first step when considering a company's debt levels is to consider its cash and debt together.
View our latest analysis for Tekmar Group
What Is Tekmar Group's Debt?
The image below, which you can click on for greater detail, shows that at March 2023 Tekmar Group had debt of UK£7.00m, up from UK£5.64m in one year. On the flip side, it has UK£3.70m in cash leading to net debt of about UK£3.30m.
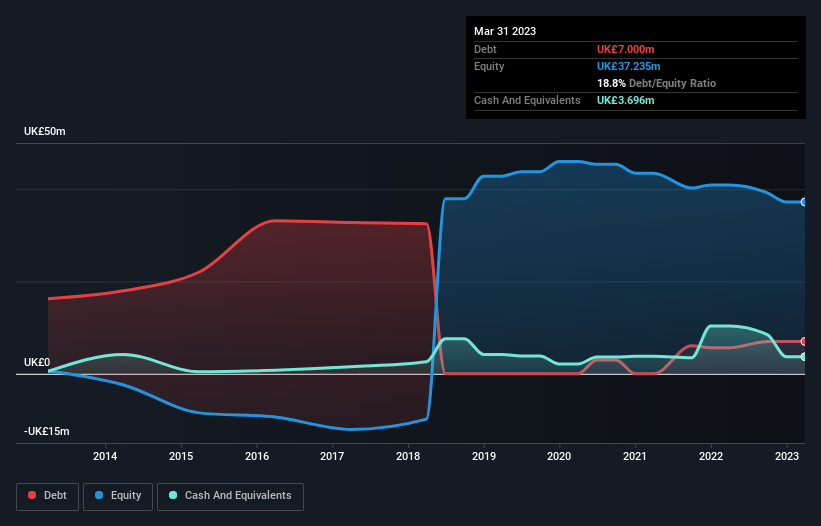
A Look At Tekmar Group's Liabilities
The latest balance sheet data shows that Tekmar Group had liabilities of UK£20.0m due within a year, and liabilities of UK£1.87m falling due after that. Offsetting this, it had UK£3.70m in cash and UK£18.0m in receivables that were due within 12 months. So its total liabilities are just about perfectly matched by its shorter-term, liquid assets.
This state of affairs indicates that Tekmar Group's balance sheet looks quite solid, as its total liabilities are just about equal to its liquid assets. So it's very unlikely that the UK£16.3m company is short on cash, but still worth keeping an eye on the balance sheet. There's no doubt that we learn most about debt from the balance sheet. But you can't view debt in total isolation; since Tekmar Group will need earnings to service that debt. So when considering debt, it's definitely worth looking at the earnings trend. Click here for an interactive snapshot.
In the last year Tekmar Group wasn't profitable at an EBIT level, but managed to grow its revenue by 14%, to UK£35m. That rate of growth is a bit slow for our taste, but it takes all types to make a world.
Caveat Emptor
Importantly, Tekmar Group had an earnings before interest and tax (EBIT) loss over the last year. Indeed, it lost a very considerable UK£3.2m at the EBIT level. Considering that alongside the liabilities mentioned above does not give us much confidence that company should be using so much debt. Quite frankly we think the balance sheet is far from match-fit, although it could be improved with time. Another cause for caution is that is bled UK£7.4m in negative free cash flow over the last twelve months. So suffice it to say we consider the stock very risky. When analysing debt levels, the balance sheet is the obvious place to start. But ultimately, every company can contain risks that exist outside of the balance sheet. We've identified 5 warning signs with Tekmar Group (at least 3 which are a bit concerning) , and understanding them should be part of your investment process.
At the end of the day, it's often better to focus on companies that are free from net debt. You can access our special list of such companies (all with a track record of profit growth). It's free.
Valuation is complex, but we're here to simplify it.
Discover if Tekmar Group might be undervalued or overvalued with our detailed analysis, featuring fair value estimates, potential risks, dividends, insider trades, and its financial condition.
Access Free AnalysisHave feedback on this article? Concerned about the content? Get in touch with us directly. Alternatively, email editorial-team (at) simplywallst.com.
This article by Simply Wall St is general in nature. We provide commentary based on historical data and analyst forecasts only using an unbiased methodology and our articles are not intended to be financial advice. It does not constitute a recommendation to buy or sell any stock, and does not take account of your objectives, or your financial situation. We aim to bring you long-term focused analysis driven by fundamental data. Note that our analysis may not factor in the latest price-sensitive company announcements or qualitative material. Simply Wall St has no position in any stocks mentioned.
About AIM:TGP
Tekmar Group
Designs, manufactures, and supplies subsea stability and protection technology to offshore energy markets.
Undervalued with high growth potential.
Market Insights

Advertisement
Community Narratives
MicroVision will explode future revenue by 380.37% with a vision towards success
Fair Value US$60.00|98.4% undervalued
TH
Community Contributor
The Indispensable Artery for a New North American Economy
Fair Value CA$132.87|1.3% undervalued
TI
Community Contributor