
Advertisement
Some say volatility, rather than debt, is the best way to think about risk as an investor, but Warren Buffett famously said that 'Volatility is far from synonymous with risk.' When we think about how risky a company is, we always like to look at its use of debt, since debt overload can lead to ruin. We note that Star Energy Group Plc (LON:STAR) does have debt on its balance sheet. But the real question is whether this debt is making the company risky.
Why Does Debt Bring Risk?
Debt assists a business until the business has trouble paying it off, either with new capital or with free cash flow. Ultimately, if the company can't fulfill its legal obligations to repay debt, shareholders could walk away with nothing. However, a more frequent (but still costly) occurrence is where a company must issue shares at bargain-basement prices, permanently diluting shareholders, just to shore up its balance sheet. Of course, the upside of debt is that it often represents cheap capital, especially when it replaces dilution in a company with the ability to reinvest at high rates of return. The first step when considering a company's debt levels is to consider its cash and debt together.
What Is Star Energy Group's Debt?
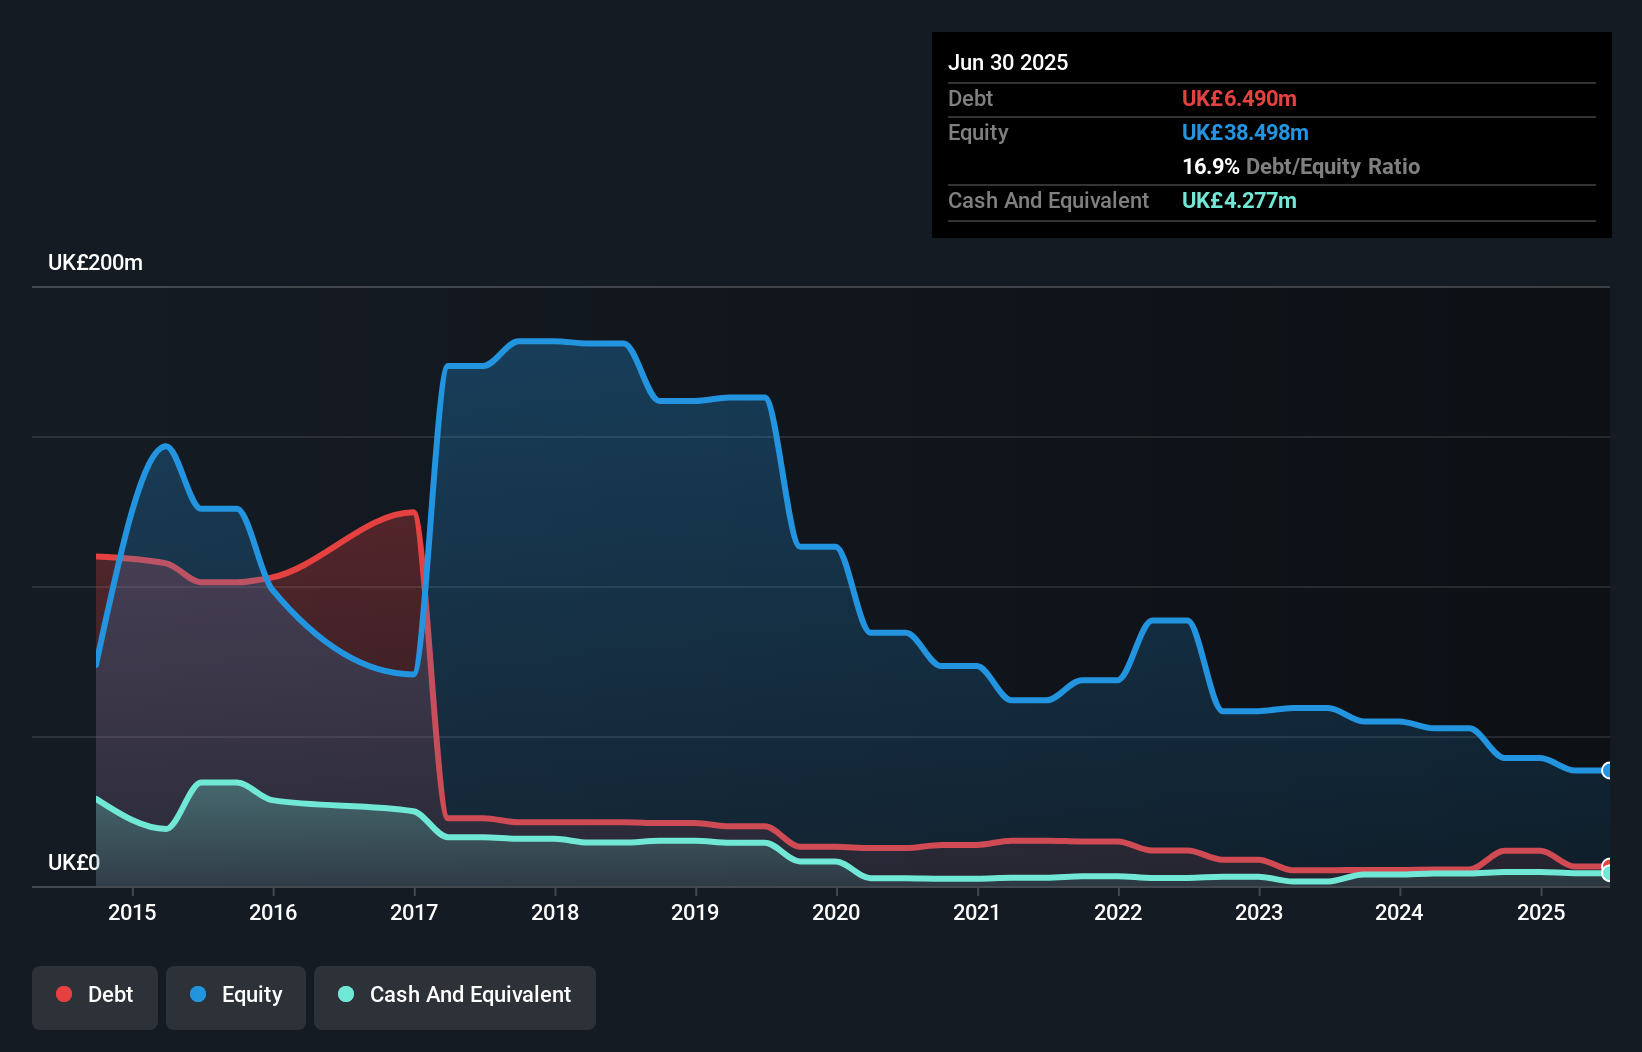
As you can see below, at the end of June 2025, Star Energy Group had UK£6.49m of debt, up from UK£5.48m a year ago. Click the image for more detail. However, it does have UK£4.28m in cash offsetting this, leading to net debt of about UK£2.21m.
How Strong Is Star Energy Group's Balance Sheet?
The latest balance sheet data shows that Star Energy Group had liabilities of UK£10.1m due within a year, and liabilities of UK£72.5m falling due after that. Offsetting these obligations, it had cash of UK£4.28m as well as receivables valued at UK£4.66m due within 12 months. So its liabilities outweigh the sum of its cash and (near-term) receivables by UK£73.7m.
The deficiency here weighs heavily on the UK£10.1m company itself, as if a child were struggling under the weight of an enormous back-pack full of books, his sports gear, and a trumpet. So we'd watch its balance sheet closely, without a doubt. At the end of the day, Star Energy Group would probably need a major re-capitalization if its creditors were to demand repayment.
View our latest analysis for Star Energy Group
We measure a company's debt load relative to its earnings power by looking at its net debt divided by its earnings before interest, tax, depreciation, and amortization (EBITDA) and by calculating how easily its earnings before interest and tax (EBIT) cover its interest expense (interest cover). The advantage of this approach is that we take into account both the absolute quantum of debt (with net debt to EBITDA) and the actual interest expenses associated with that debt (with its interest cover ratio).
While Star Energy Group's low debt to EBITDA ratio of 0.14 suggests only modest use of debt, the fact that EBIT only covered the interest expense by 3.3 times last year does give us pause. But the interest payments are certainly sufficient to have us thinking about how affordable its debt is. Notably, Star Energy Group made a loss at the EBIT level, last year, but improved that to positive EBIT of UK£7.0m in the last twelve months. When analysing debt levels, the balance sheet is the obvious place to start. But ultimately the future profitability of the business will decide if Star Energy Group can strengthen its balance sheet over time. So if you're focused on the future you can check out this free report showing analyst profit forecasts.
Finally, a company can only pay off debt with cold hard cash, not accounting profits. So it's worth checking how much of the earnings before interest and tax (EBIT) is backed by free cash flow. Over the last year, Star Energy Group saw substantial negative free cash flow, in total. While investors are no doubt expecting a reversal of that situation in due course, it clearly does mean its use of debt is more risky.
Our View
On the face of it, Star Energy Group's conversion of EBIT to free cash flow left us tentative about the stock, and its level of total liabilities was no more enticing than the one empty restaurant on the busiest night of the year. But on the bright side, its net debt to EBITDA is a good sign, and makes us more optimistic. Overall, it seems to us that Star Energy Group's balance sheet is really quite a risk to the business. For this reason we're pretty cautious about the stock, and we think shareholders should keep a close eye on its liquidity. There's no doubt that we learn most about debt from the balance sheet. But ultimately, every company can contain risks that exist outside of the balance sheet. For example, we've discovered 3 warning signs for Star Energy Group that you should be aware of before investing here.
At the end of the day, it's often better to focus on companies that are free from net debt. You can access our special list of such companies (all with a track record of profit growth). It's free.
New: Manage All Your Stock Portfolios in One Place
We've created the ultimate portfolio companion for stock investors, and it's free.
• Connect an unlimited number of Portfolios and see your total in one currency
• Be alerted to new Warning Signs or Risks via email or mobile
• Track the Fair Value of your stocks
Have feedback on this article? Concerned about the content? Get in touch with us directly. Alternatively, email editorial-team (at) simplywallst.com.
This article by Simply Wall St is general in nature. We provide commentary based on historical data and analyst forecasts only using an unbiased methodology and our articles are not intended to be financial advice. It does not constitute a recommendation to buy or sell any stock, and does not take account of your objectives, or your financial situation. We aim to bring you long-term focused analysis driven by fundamental data. Note that our analysis may not factor in the latest price-sensitive company announcements or qualitative material. Simply Wall St has no position in any stocks mentioned.
About AIM:STAR
Star Energy Group
Operates as an oil and gas exploration, development, processing, and production company in the United Kingdom.
Fair value with mediocre balance sheet.
Similar Companies
Market Insights

Advertisement
Community Narratives
MINISO's fair value is projected at 26.69 with an anticipated PE ratio shift of 20x
Fair Value US$24.03|9.0% undervalued
BE
Community Contributor
Procter & Gamble: A Dividend Giant Facing Slowing Growth
Fair Value US$119.81|23.5% overvalued
AN
Community Contributor
Eli Lilly's Future Growth Driven by Tirzepatide and Favorable Market Conditions
Fair Value US$1.19k|14.4% undervalued
EA
Community Contributor