
Advertisement
- United Kingdom
- /
- Oil and Gas
- /
- AIM:JOG
We're Not Very Worried About Jersey Oil and Gas' (LON:JOG) Cash Burn Rate
We can readily understand why investors are attracted to unprofitable companies. For example, although software-as-a-service business Salesforce.com lost money for years while it grew recurring revenue, if you held shares since 2005, you'd have done very well indeed. But while history lauds those rare successes, those that fail are often forgotten; who remembers Pets.com?
So, the natural question for Jersey Oil and Gas (LON:JOG) shareholders is whether they should be concerned by its rate of cash burn. For the purposes of this article, cash burn is the annual rate at which an unprofitable company spends cash to fund its growth; its negative free cash flow. First, we'll determine its cash runway by comparing its cash burn with its cash reserves.
See our latest analysis for Jersey Oil and Gas
How Long Is Jersey Oil and Gas' Cash Runway?
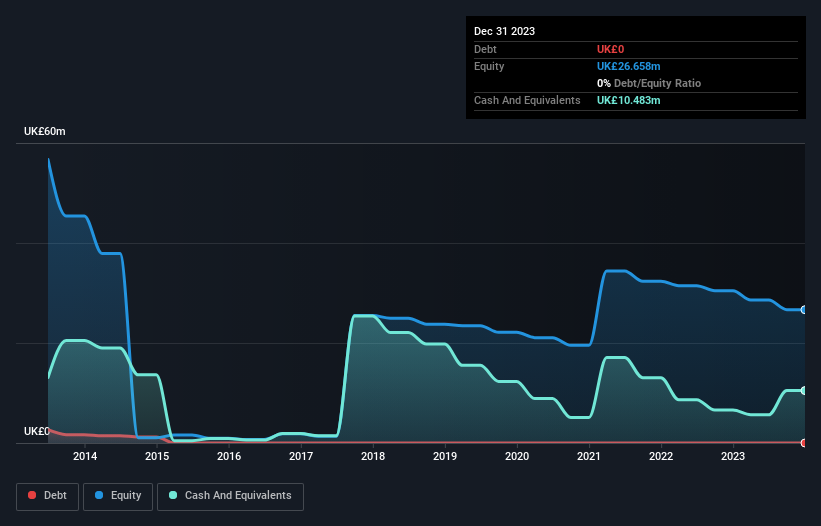
You can calculate a company's cash runway by dividing the amount of cash it has by the rate at which it is spending that cash. As at December 2023, Jersey Oil and Gas had cash of UK£10m and no debt. Importantly, its cash burn was UK£5.1m over the trailing twelve months. That means it had a cash runway of about 2.1 years as of December 2023. Arguably, that's a prudent and sensible length of runway to have. The image below shows how its cash balance has been changing over the last few years.
How Is Jersey Oil and Gas' Cash Burn Changing Over Time?
Because Jersey Oil and Gas isn't currently generating revenue, we consider it an early-stage business. So while we can't look to sales to understand growth, we can look at how the cash burn is changing to understand how expenditure is trending over time. As it happens, the company's cash burn reduced by 20% over the last year, which suggests that management are maintaining a fairly steady rate of business development, albeit with a slight decrease in spending. Clearly, however, the crucial factor is whether the company will grow its business going forward. For that reason, it makes a lot of sense to take a look at our analyst forecasts for the company.
How Hard Would It Be For Jersey Oil and Gas To Raise More Cash For Growth?
Even though it has reduced its cash burn recently, shareholders should still consider how easy it would be for Jersey Oil and Gas to raise more cash in the future. Generally speaking, a listed business can raise new cash through issuing shares or taking on debt. Many companies end up issuing new shares to fund future growth. We can compare a company's cash burn to its market capitalisation to get a sense for how many new shares a company would have to issue to fund one year's operations.
Jersey Oil and Gas' cash burn of UK£5.1m is about 8.6% of its UK£59m market capitalisation. That's a low proportion, so we figure the company would be able to raise more cash to fund growth, with a little dilution, or even to simply borrow some money.
How Risky Is Jersey Oil and Gas' Cash Burn Situation?
Jersey Oil and Gas appears to be in pretty good health when it comes to its cash burn situation. One the one hand we have its solid cash runway, while on the other it can also boast very strong cash burn relative to its market cap. Considering all the factors discussed in this article, we're not overly concerned about the company's cash burn, although we do think shareholders should keep an eye on how it develops. On another note, Jersey Oil and Gas has 4 warning signs (and 2 which shouldn't be ignored) we think you should know about.
If you would prefer to check out another company with better fundamentals, then do not miss this free list of interesting companies, that have HIGH return on equity and low debt or this list of stocks which are all forecast to grow.
New: Manage All Your Stock Portfolios in One Place
We've created the ultimate portfolio companion for stock investors, and it's free.
• Connect an unlimited number of Portfolios and see your total in one currency
• Be alerted to new Warning Signs or Risks via email or mobile
• Track the Fair Value of your stocks
Have feedback on this article? Concerned about the content? Get in touch with us directly. Alternatively, email editorial-team (at) simplywallst.com.
This article by Simply Wall St is general in nature. We provide commentary based on historical data and analyst forecasts only using an unbiased methodology and our articles are not intended to be financial advice. It does not constitute a recommendation to buy or sell any stock, and does not take account of your objectives, or your financial situation. We aim to bring you long-term focused analysis driven by fundamental data. Note that our analysis may not factor in the latest price-sensitive company announcements or qualitative material. Simply Wall St has no position in any stocks mentioned.
About AIM:JOG
Jersey Oil and Gas
Engages in the exploration, appraisal, development, and production of oil and gas properties in the North Sea of the United Kingdom.
Excellent balance sheet with slight risk.
Similar Companies
Market Insights

Advertisement
Community Narratives
The company that turned a verb into a global necessity and basically runs the modern internet, digital ads, smartphones, maps, and AI.
Fair Value US$300.00|10.8% undervalued
OS
Community Contributor
Flowers Foods Pays A Fair Price For Health
Fair Value US$16.12|22.0% undervalued
NV
Community Contributor
TMX Group will thrive with 33.3% profit margin and enduring market moat
Fair Value CA$49.90|3.8% overvalued
LI
Community Contributor